S&P 500 Key Levels This Week — Support, Resistance & Confluence Zones
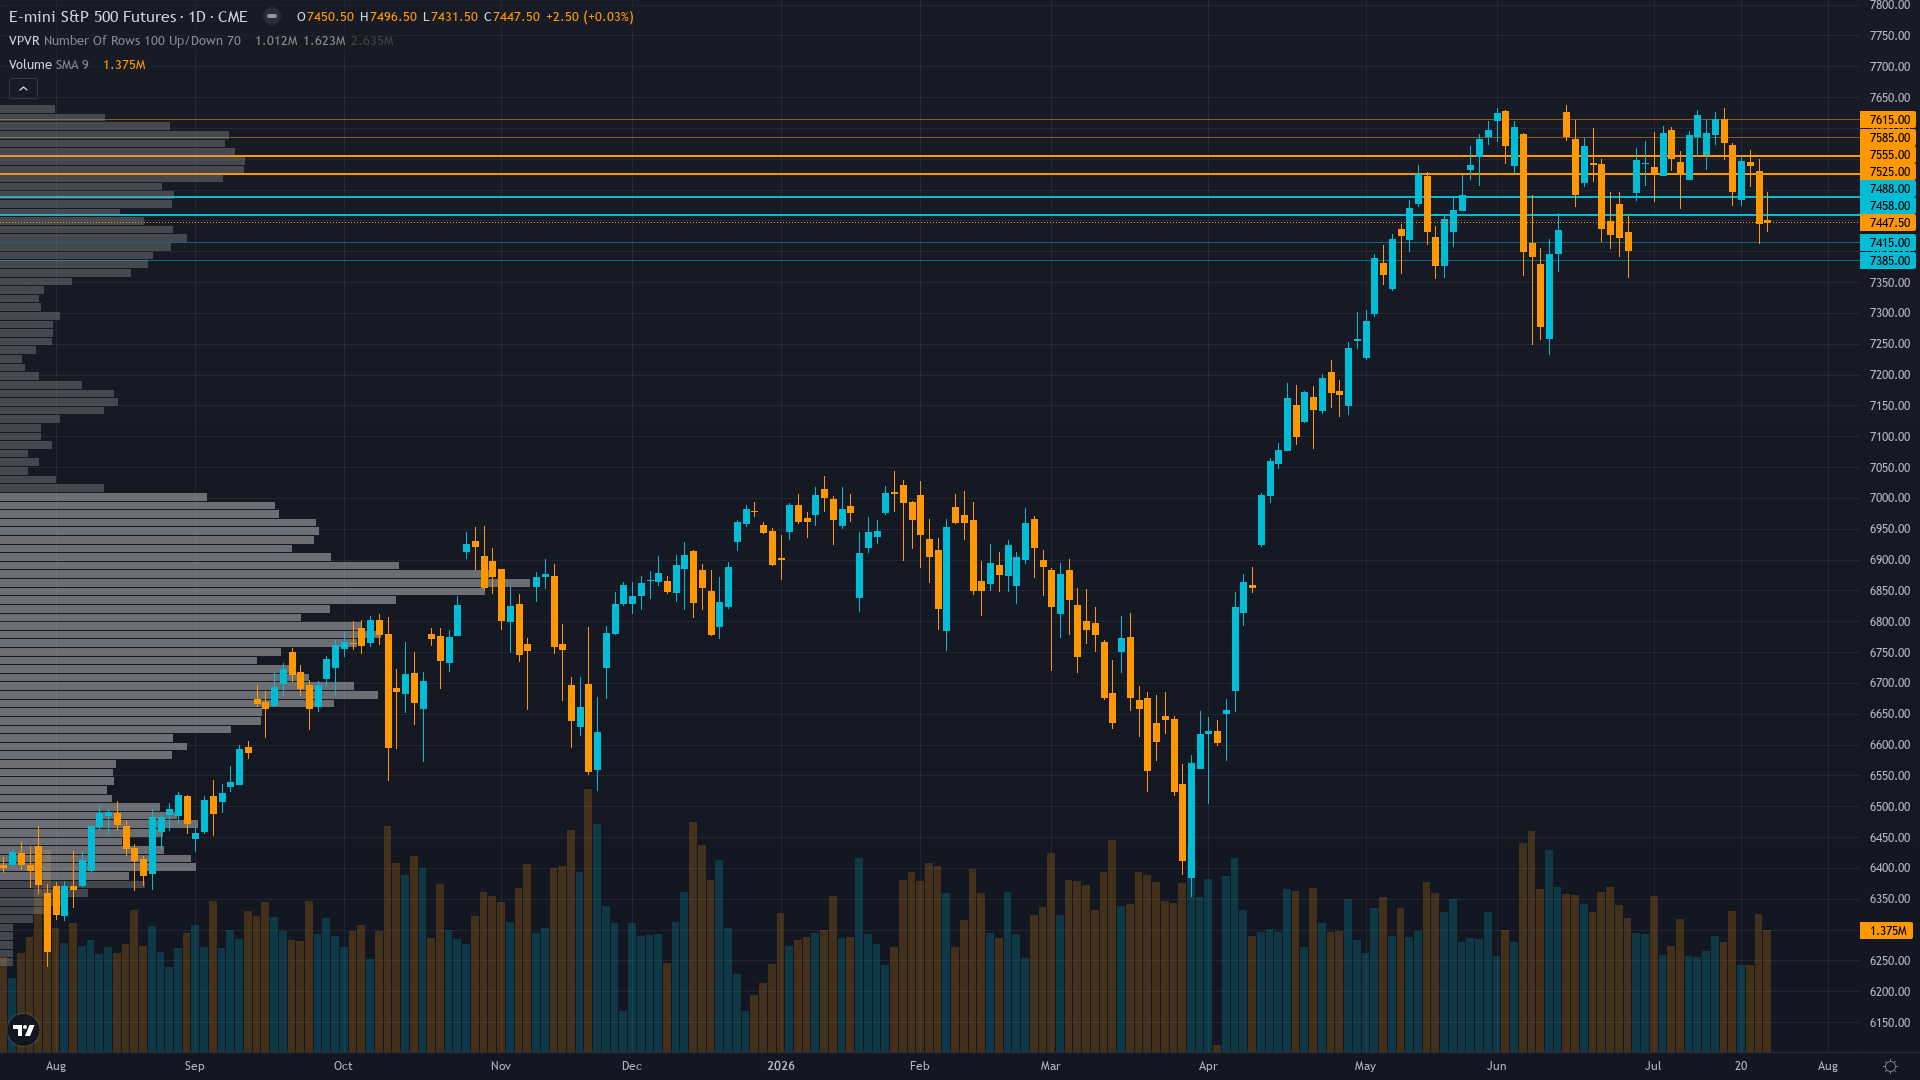
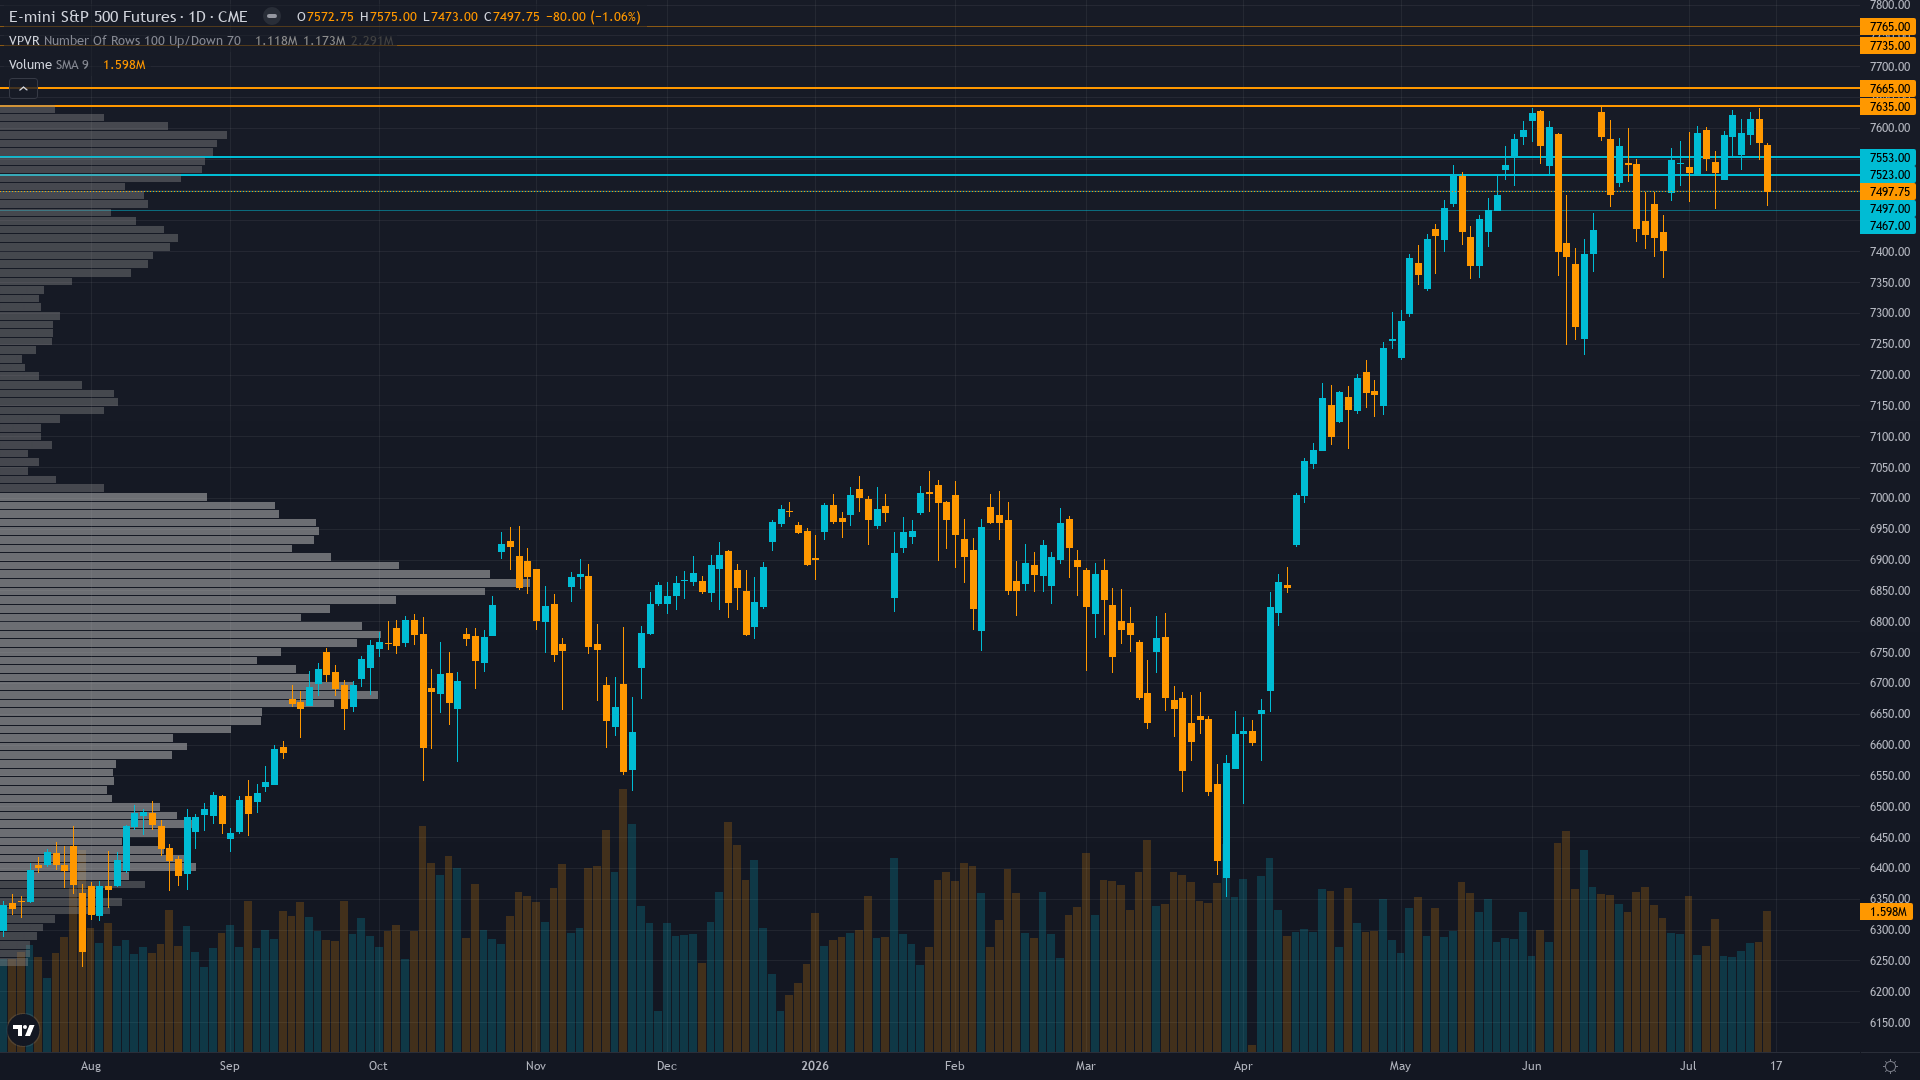
S&P 500 key levels breakdown: support zones, resistance zones, confluence and price structure.
S&P 500 key levels breakdown: support zones, resistance zones, confluence and price structure.
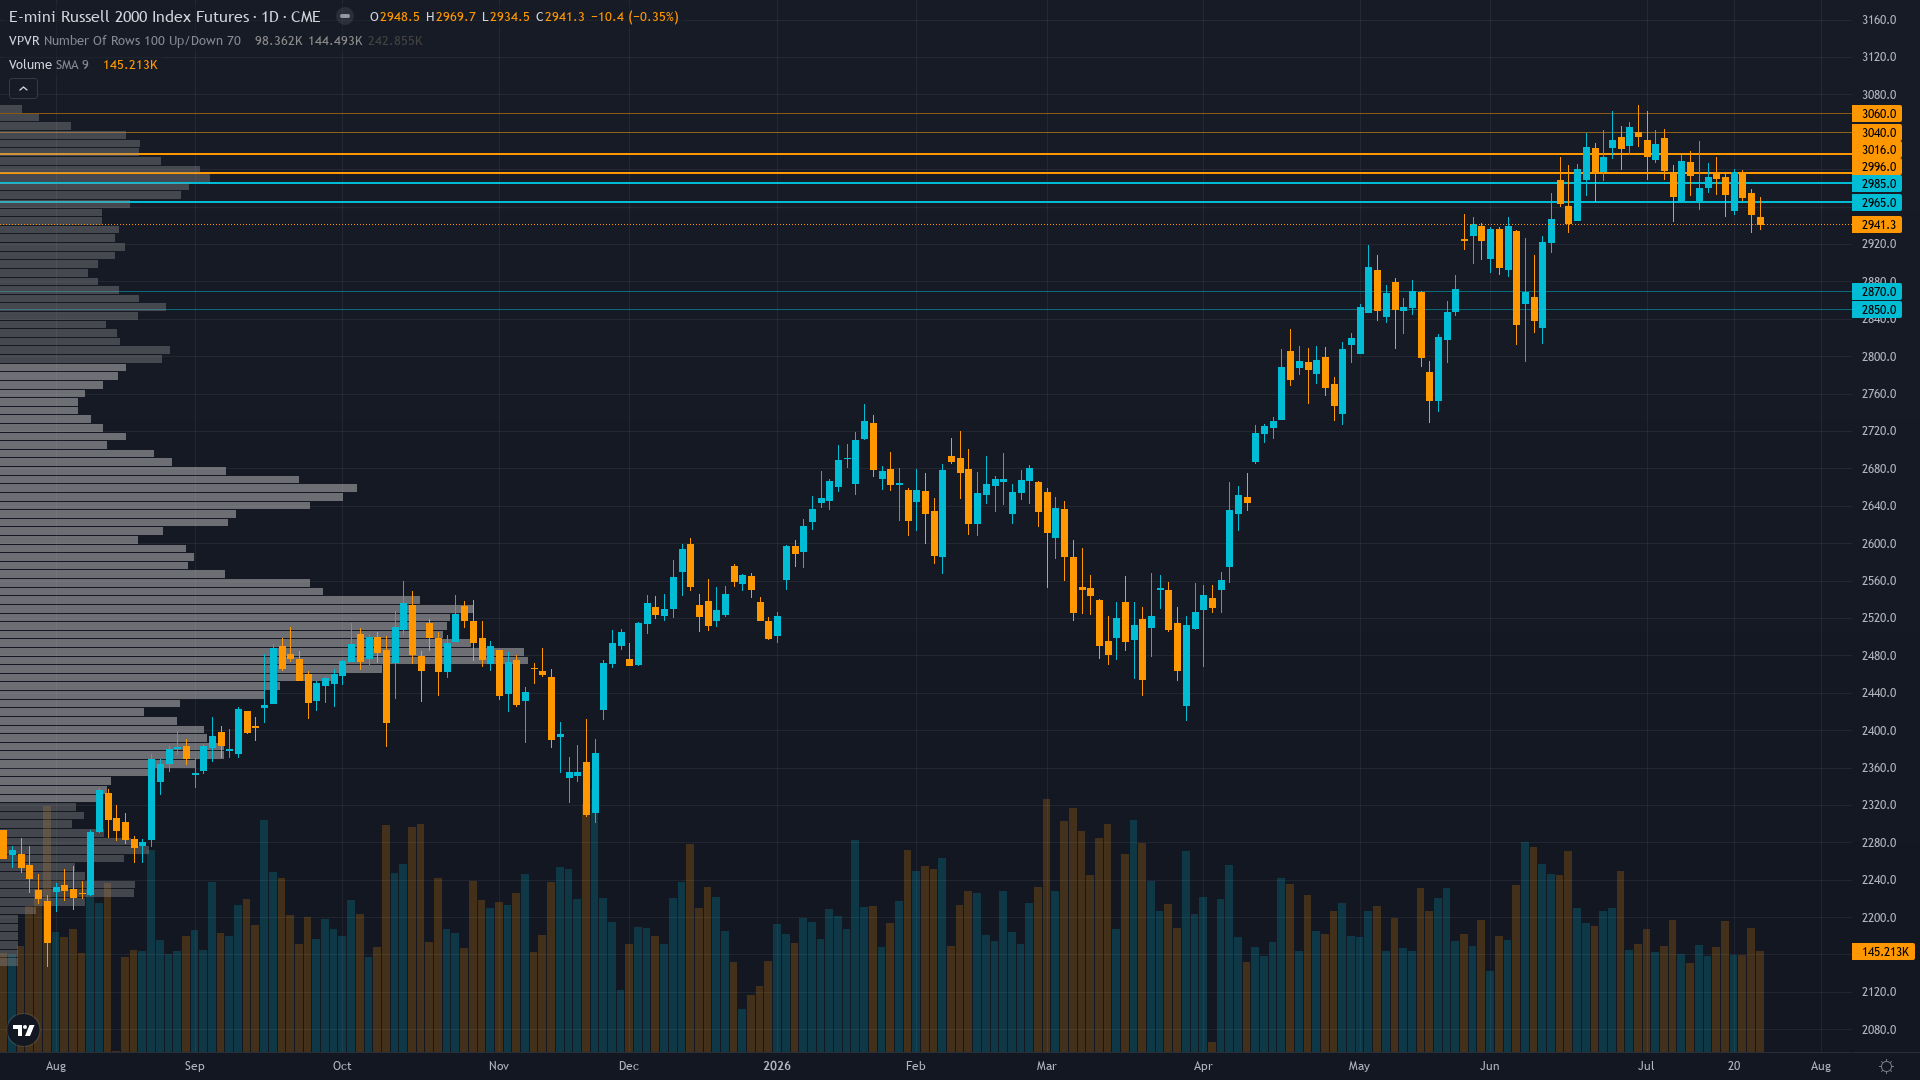
Russell 2000 institutional positioning: COT data, sentiment analysis and smart money flow assessment.
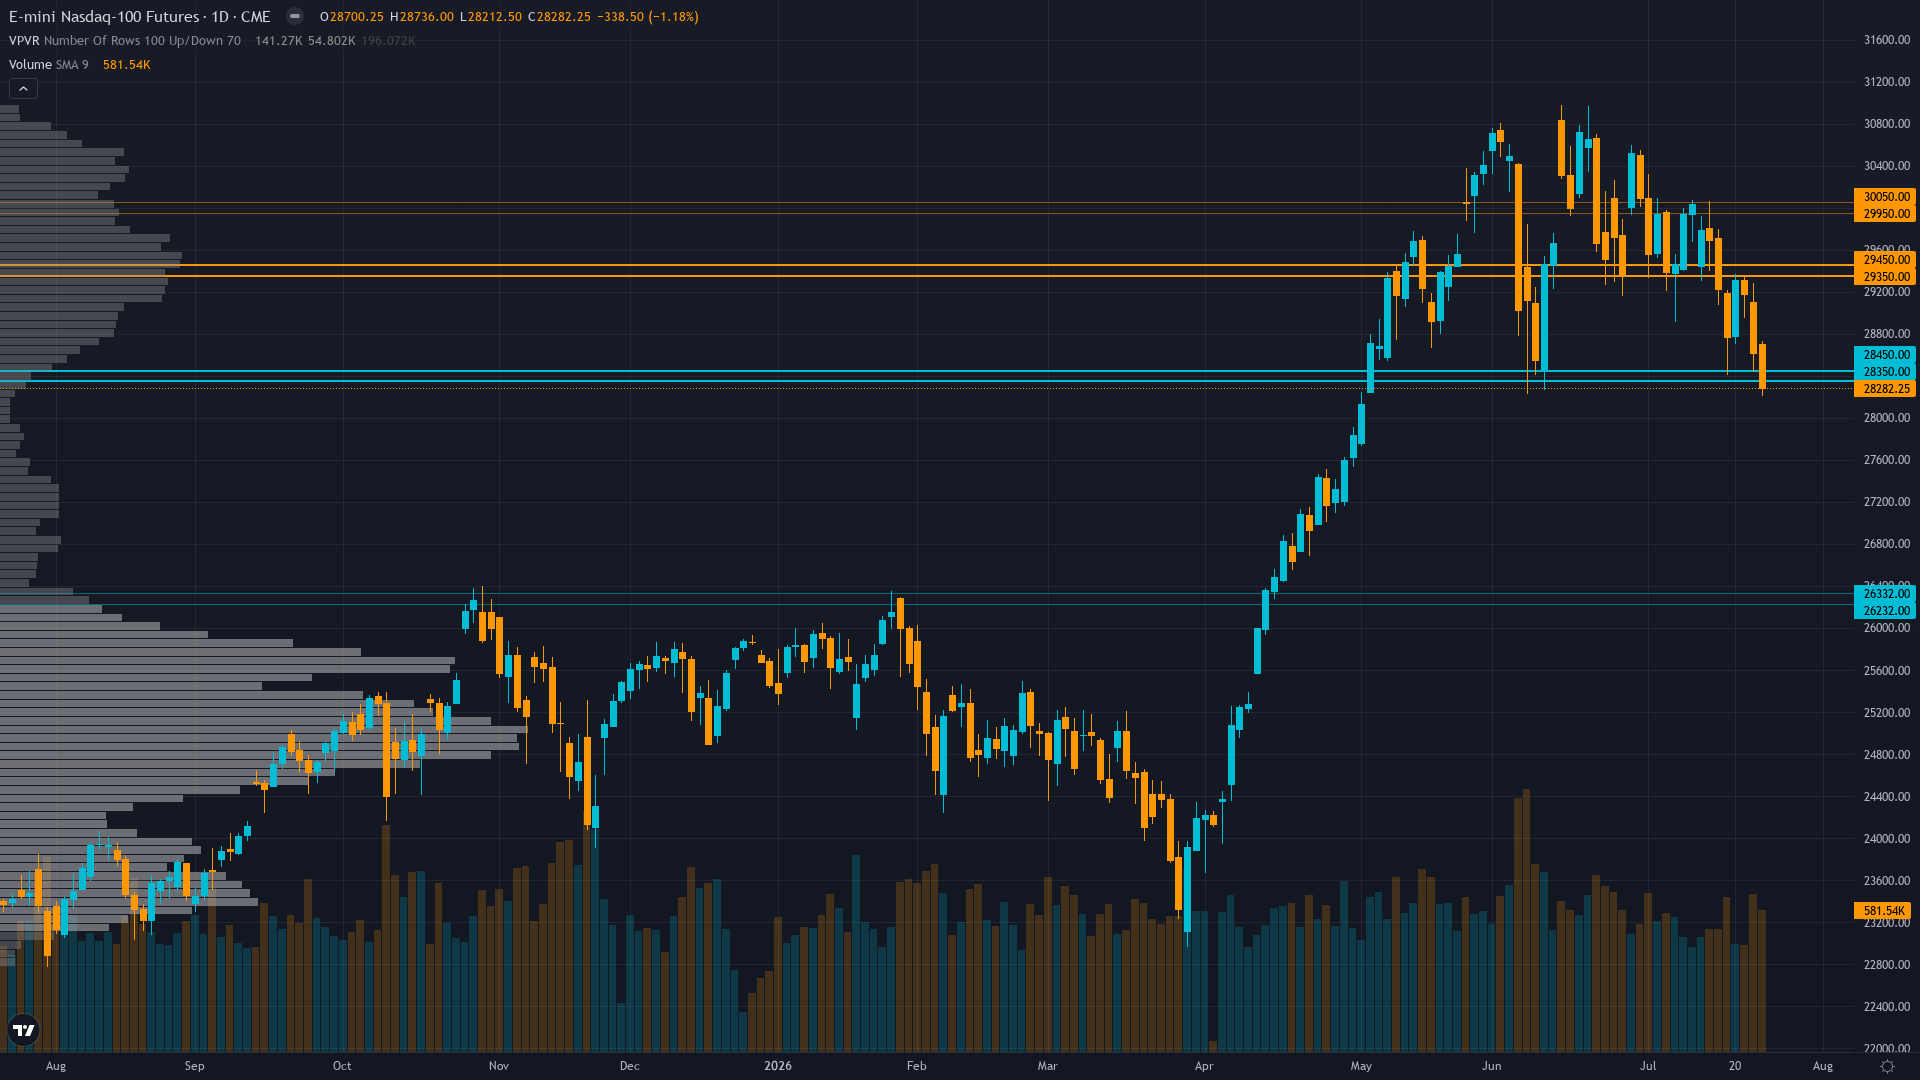
This week's Nasdaq 100 outlook: key drivers, volatility context, risk-opportunity assessment and the week ahead.
This week's Russell 2000 outlook: key drivers, volatility context, risk-opportunity assessment and the week ahead.
This week's S&P 500 outlook: key drivers, volatility context, risk-opportunity assessment and the week ahead.
Russell 2000 (RTY): Market consensus positioning for July 28-29 FOMC hold at 75% probability may be underpricing hawkish surprise risk evidenced by 25% hike probability up from near-zero earlier in July and persistent 3.5% CPI with oil-driven inflation pressures, while desk recognizes acute vulnerab
Core
Divided between oversold bounce buyers targeting 7,500-7,540 relief rally into FOMC and breakdown sellers expecting 7,319-7,200 continuation if Fed delivers hawkish surprise, with majority positioning cautiously ahead of July 29 binary outcome while acknowledging Q2 earnings validation creates funda
Core
Defensively positioned ahead of July 29 FOMC acknowledging 25% hike probability from oil surge and inflation persistence, cautious on elevated valuations requiring Q2 earnings validation, but divided on whether technical breakdown represents genuine trend reversal or tactical selloff before event cl
S&P 500 institutional positioning: COT data, sentiment analysis and smart money flow assessment.
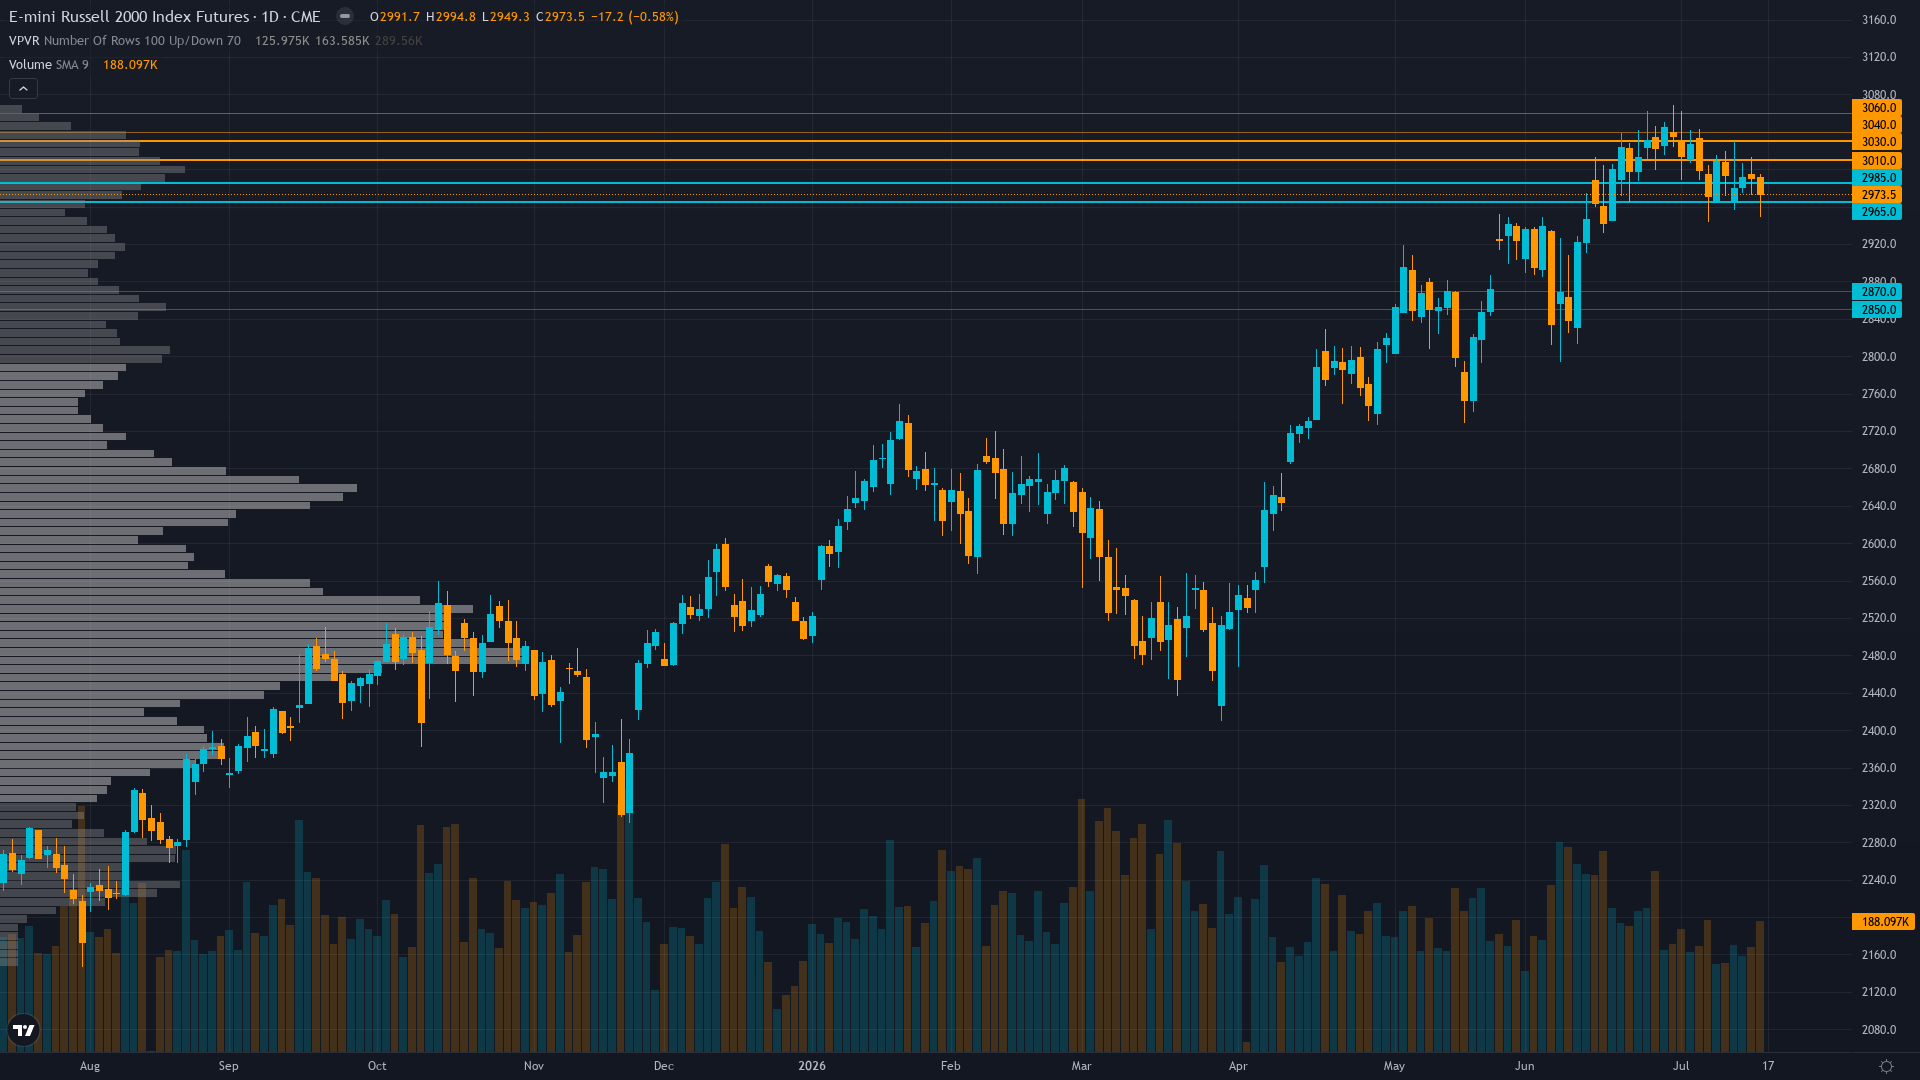
Russell 2000 key levels breakdown: support zones, resistance zones, confluence and price structure.
This week's S&P 500 outlook: key drivers, volatility context, risk-opportunity assessment and the week ahead.
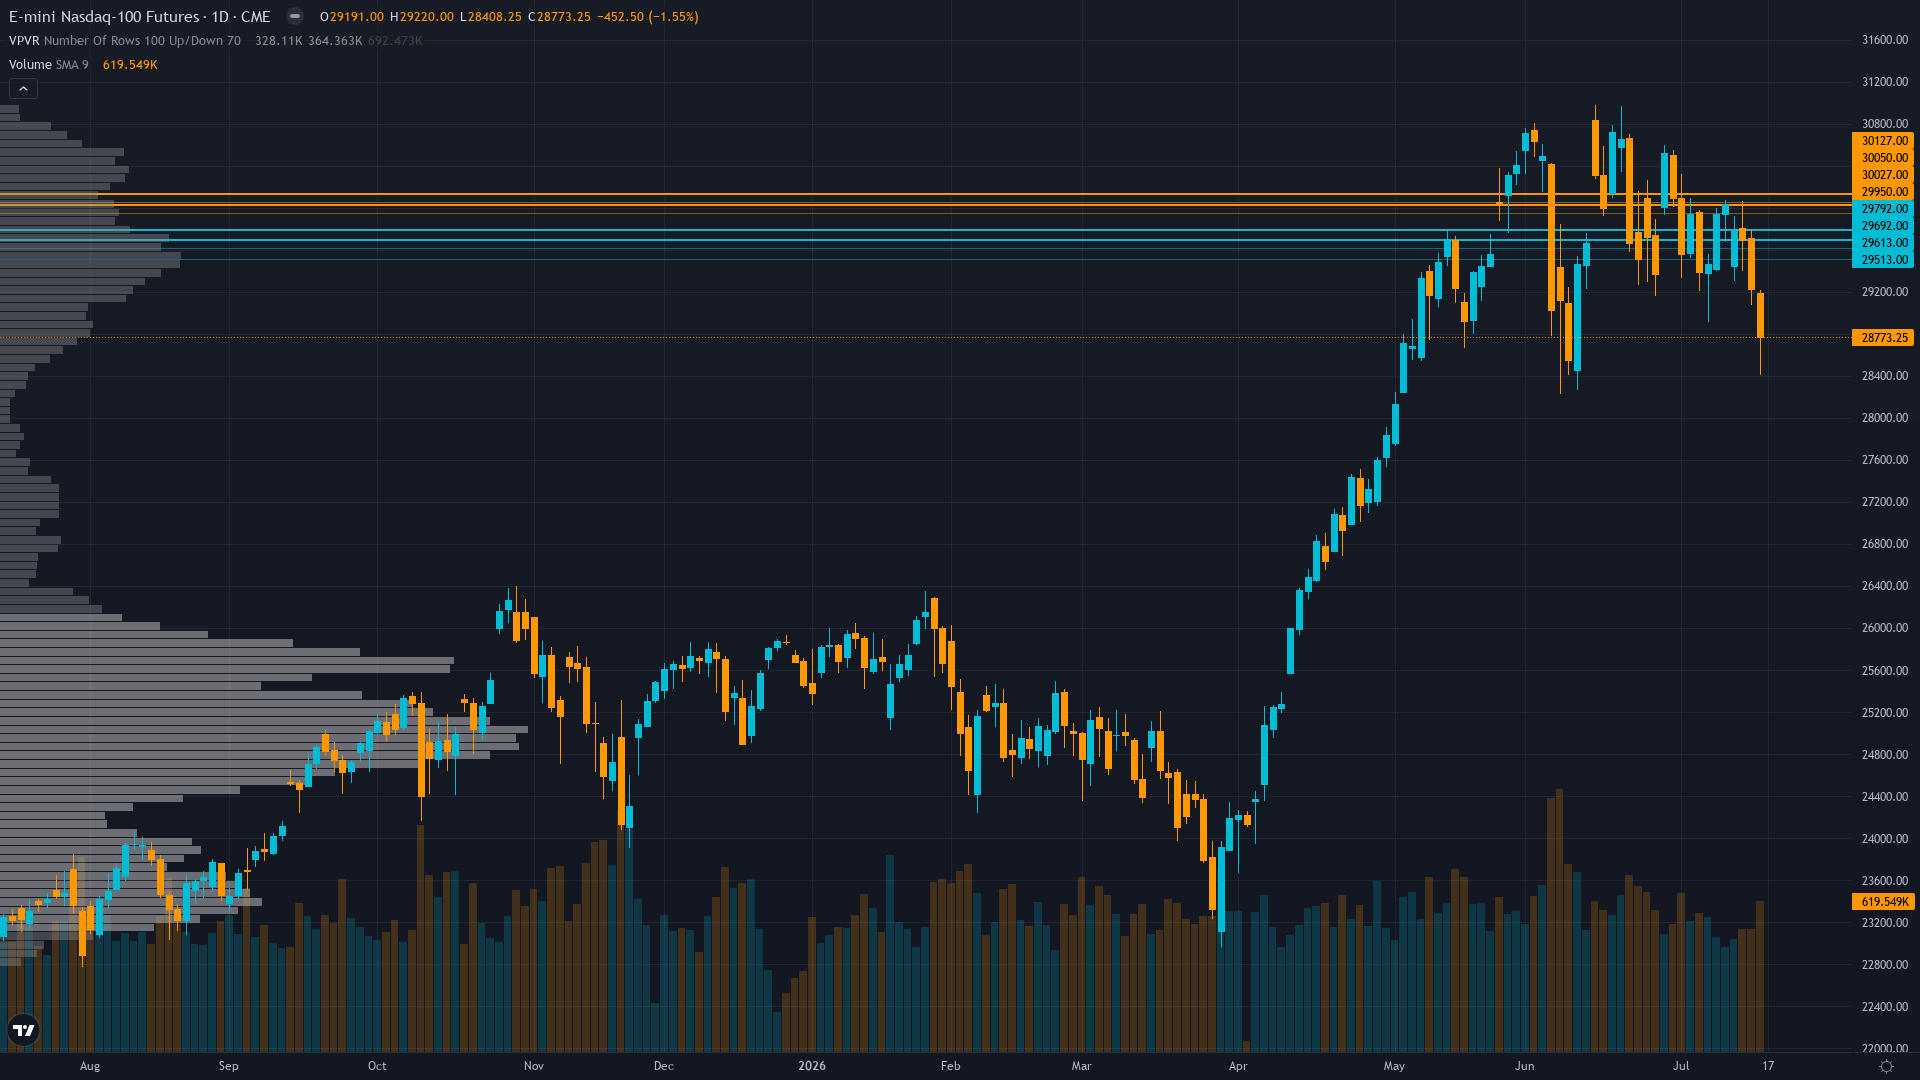
Nasdaq 100 key levels breakdown: support zones, resistance zones, confluence and price structure.