S&P 500 COT & Institutional Positioning — Smart Money Analysis
S&P 500 institutional positioning: COT data, sentiment analysis and smart money flow assessment.

The Institutional Landscape
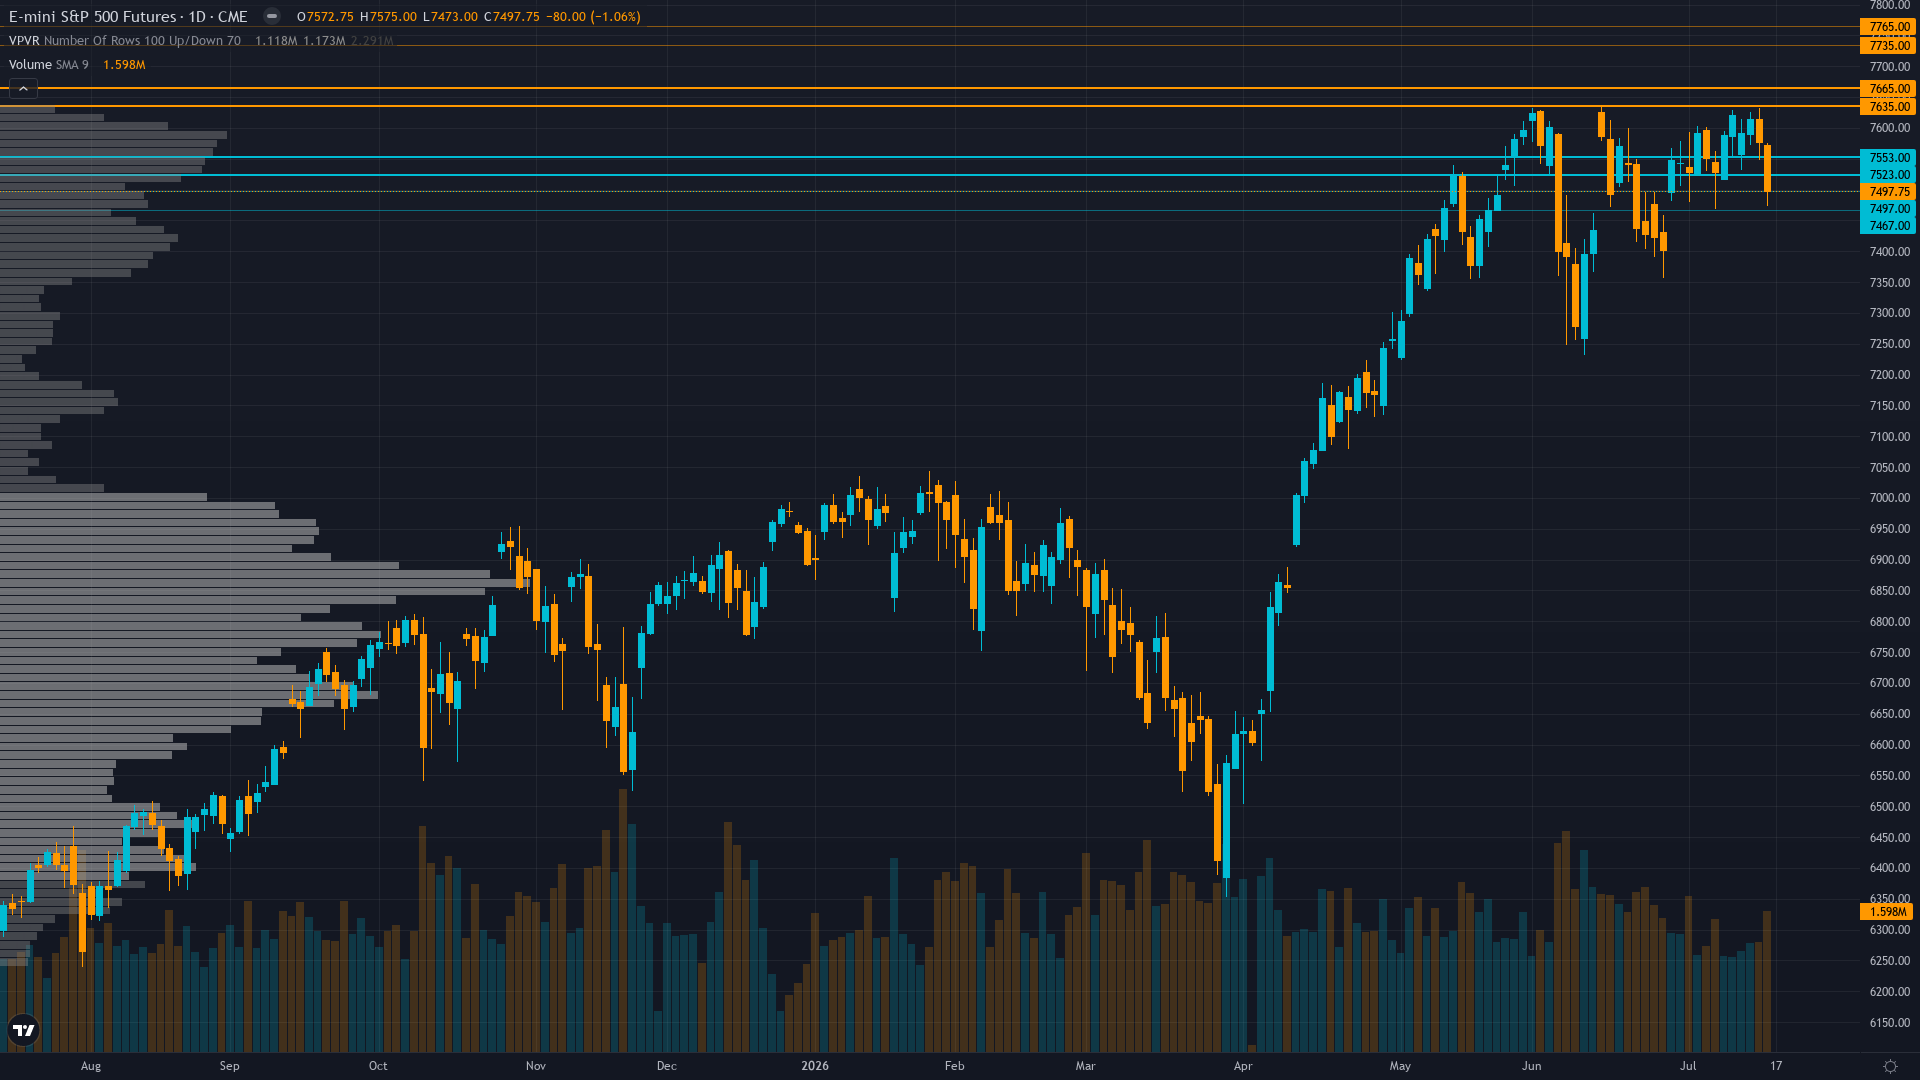
Trading at 7495.75 after a 1.65% slide, S&P 500 faces sustained selling interest.
Asset managers heavily net long 969K contracts (34.4% of open interest) per stale July 7 COT data creating crowded long positioning vulnerability, massive QQQ $10.62B July 6 inflow suggests institutional accumulation but Q2 earnings blackout removes buyback support through late July creating mechanical headwind precisely when positioning extended
Market Sentiment
The sentiment picture for S&P 500 futures is evenly split, providing no contrarian signal in either direction. The next move will likely be event-driven.
What Options Markets Show
VIX spiked to 18.77 on July 17 (+12.19% single-session) before compressing back to 15.67-16 range showing brief fear episode that subsided, equity put/call 0.73 normal-to-low range indicates modest complacency, positive gamma regime $7.45B creates range-bound bias with mechanical support 7,550 put wall
Consensus vs MAD View
Market consensus: Cautiously bullish on Q2 earnings strength beginning to validate expectations but increasingly aware only 10% of companies reported through July 17 leaving 90% of validation ahead, expecting consolidation in 7,450-7,550 range into July 28-29 FOMC with breakout above 7,600 dependent on earnings execution
Primary driver: ES consolidates at 7,495.75 after -1.74% weekly decline from 7,620.25 following VIX spike to 18.77 on July 17 (+12.19% single-session) that created brief fear episode now subsiding, as Q2 earnings season reaches only 10% completion through July 17 with 23.3% growth rate confirmed but 90% of companies yet to report creating fundamental uncertainty into July 28-29 FOMC binary catalyst
The Bottom Line on Positioning
The positioning mosaic for S&P index combines fear sentiment with stable volatility conditions. Trend strength registers at 6/10, suggesting meaningful but not extreme directional bias. Taken together, institutional behaviour, crowd psychology, and derivatives data frame the setup heading into the new week.
This analysis covers one dimension. Our full weekly report combines six specialist agents into a single actionable briefing with directional bias, key levels, and risk-opportunity matrix.
Start Free — Get the Market of the WeekFree weekly report · No credit card · Upgrade anytime



