Copper Forecast This Week — Outlook, Drivers & Key Levels
This week's Copper outlook: key drivers, volatility context, risk-opportunity assessment and the week ahead.

This Week's Starting Point
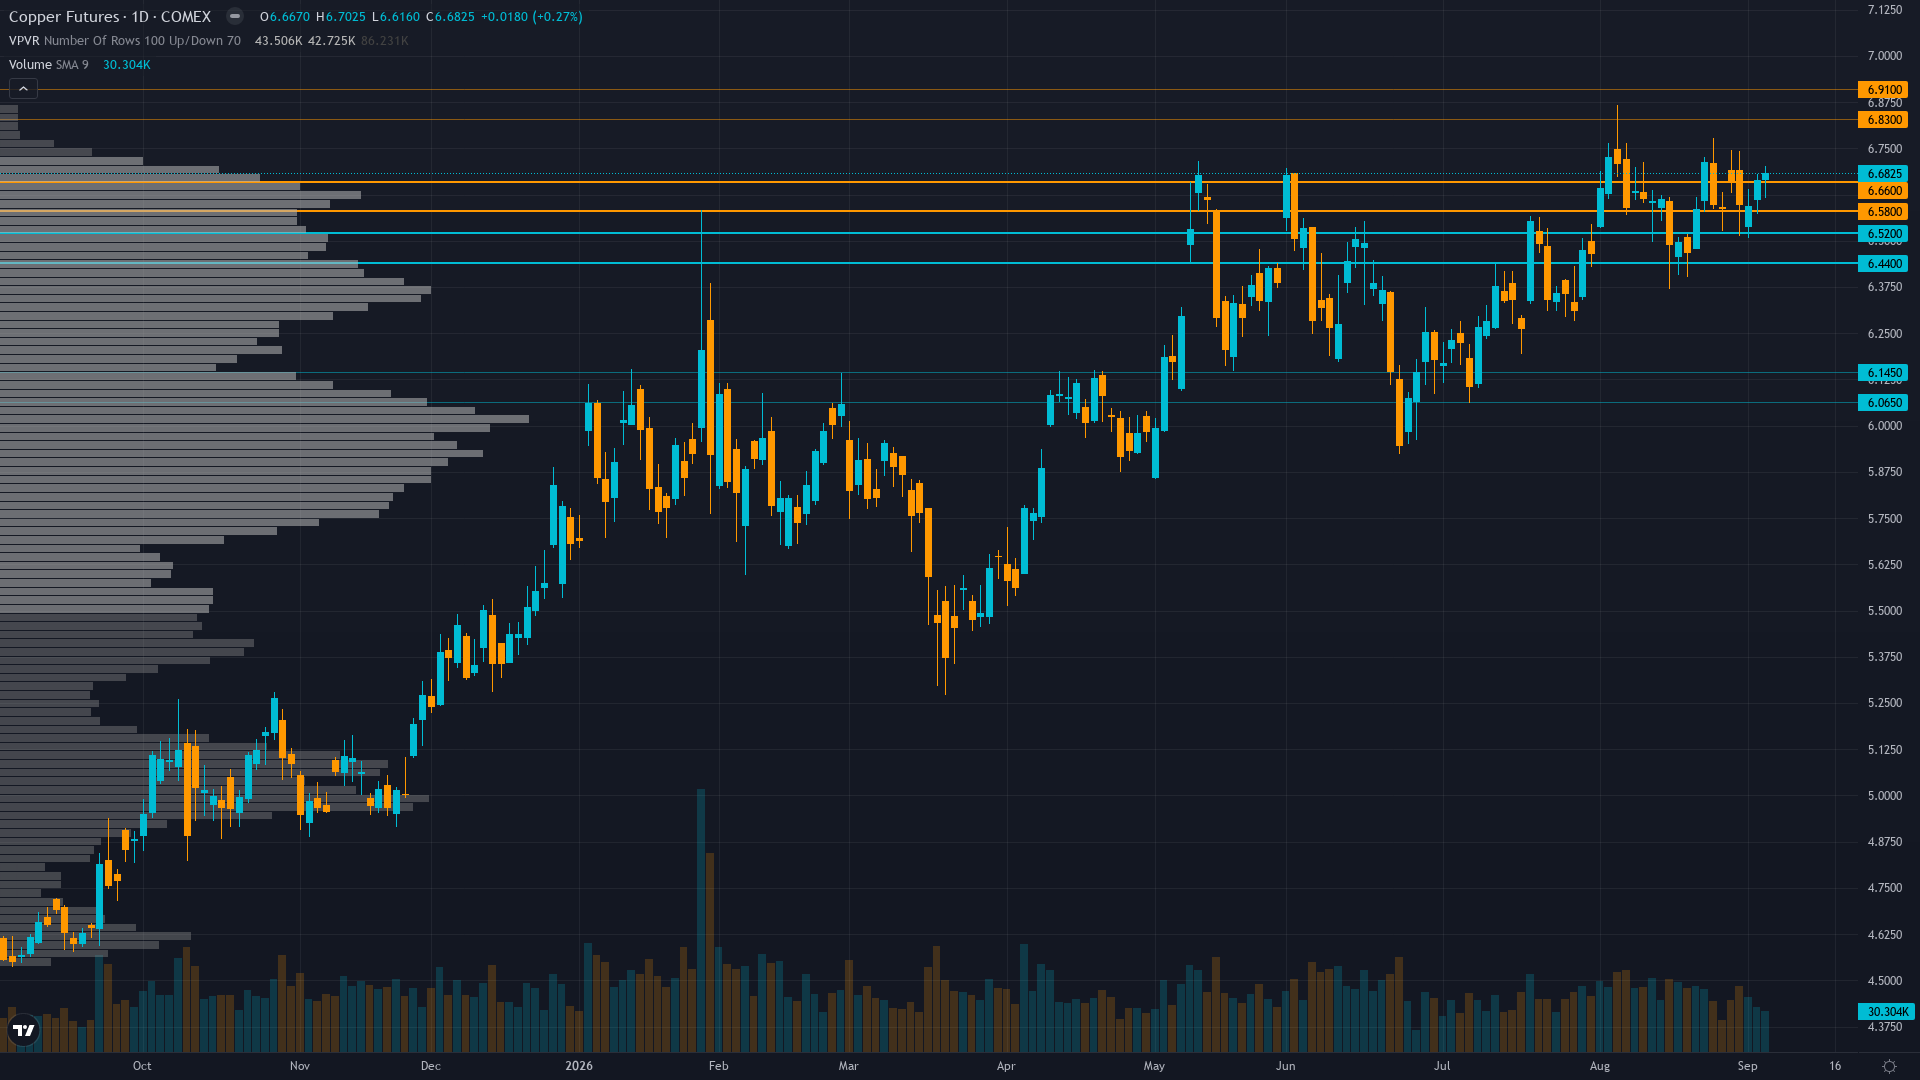
Trading at 6.597 with a 0.30% uptick, copper is drifting higher without strong conviction. Price action in copper futures has compressed into a consolidation pattern, typically a precursor to a directional breakout.
Copper consolidating near 52-week highs supported by structural supply deficit and fresh mine disruption narrative but facing headwinds from hawkish Fed repricing and extreme COT positioning as market awaits Sep 8-11 China/US data cluster for demand validation
Forces in Play
Primary driver: Fresh supply disruption narrative from Bloomberg September 3, 2026 article on mounting mine setbacks (Grasberg force majeure continuing through 2026, Quebrada Blanca downgrades, global mine supply declining 1.1% in H1) reinforces structural deficit thesis for 2026, with ICSG forecasting 150,000-tonne deficit — the first structural shortage since 2009
Secondary factor: COT speculative positioning at 80,869 net long contracts (98.7th percentile of 3-year range, CFTC Sep 1 2026) declined by -4,397 WoW from the prior week's near-record extreme, representing marginal de-risking that modestly reduces mean-reversion risk while still signalling elevated bullish conviction among managed money
Additional influence: Dense economic data week ahead — China Trade Balance (Sep 8), China CPI/PPI (Sep 9), US PPI (Sep 10), and US CPI (Sep 11) — creates binary catalyst cluster for demand narrative resolution, with consensus expecting US core CPI to hold at 2.5% YoY and China CPI to firm to 0.9% from 0.5%, providing potential demand-side validation of supply-constrained pricing
Economic backdrop: TRANSITIONAL macro regime with VIX at 14.32 (low, below 20) and recession probability at 0.76% (negligible) but JPMorgan now pricing a 25bp Sep Fed hike (previously no change), strengthening USD and creating headwind for dollar-denominated commodities; US 10Y at 4.78% (+5bp on week) and curve at +41bp 2s10s normalising; China NBS PMI improved modestly per Sep 1 release but remains near contraction threshold
Fundamental assessment: Structural deficit of 150,000 tonnes forecast for 2026 (first since 2009) with fresh Bloomberg Sep 3 confirmation of accelerating mine supply challenges — Grasberg lost 800,000 tons, global mine output down 1.1% in H1 2026, TC benchmark settled at $0/tonne for 2026 per IEA reflecting acute concentrate scarcity
Technical Landscape
Price at $6.597 consolidating within $6.55-$6.70 range near 52-week highs at 94.9% of range position, trading above both 50-day and 200-day MAs with RSI in neutral-bullish territory, Strong Buy signals per Barchart technical summary, with $6.88 52-week high as next major resistance target and $6.00 major support as key risk level
Trend strength registers at 7/10, suggesting meaningful but not extreme directional bias.
Risk-Reward Assessment
Primary risk: COT at 98.7th percentile (80,869 net long) remains extreme despite -4,397 WoW reduction; any disappointment in the Sep 8-11 data cluster — particularly US CPI above 3.4% triggering aggressive Fed repricing and USD surge — could trigger cascading speculative long liquidation from still-crowded positioning toward $6.00 major support representing 9.0% downside (Probability: medium)
Primary opportunity: Fresh supply disruption catalyst from Bloomberg Sep 3 aligns with seasonal bullish window (Sep-Dec historically strong per Seasonax, with summer dip resolving into sustained year-end recovery) and approaching ICSG October 13 Lisbon meetings that could formalise the deficit narrative; if US CPI data (Sep 11) confirms inflation moderation at 3.4% or below, the dollar headwind eases, enabling breakout above $6.70 resistance toward $6.88 52-week high representing 4.3% upside with structural deficit thesis validated across both supply and demand dimensions (Timeframe: 1-3 weeks as Sep 8-11 data cluster provides consecutive catalyst resolution with US CPI on Sep 11 as the critical confirmation signal, followed by ICSG meetings on Oct 13 providing formal deficit forecast update)
This week's edge: The market may be underweighting the significance of Bloomberg's September 3 mine setback article as a fresh supply catalyst that re-energises the structural deficit thesis entering the seasonally favourable Sep-Dec period, while over-weighting the hawkish Fed repricing risk which may prove transient if US CPI on Sep 11 confirms inflation moderation at 3.4% YoY — the supply-side evidence is current-week fresh, the COT extreme is marginally easing, and the data week ahead creates asymmetric upside if demand prints validate the supply-constrained pricing regime
Risk Environment
With vol at the 45th percentile over 90 days, copper price is in a measured regime that doesn't require unusual adjustments. Volatility is contracting, with realised vol declining across timeframes. Compressed volatility often precedes sharp directional moves as energy builds.
Current 14.5% realised vol suggests daily ranges of 1.0-1.5% below the 2.69% average weekly move for HG, reflecting controlled consolidation in the $6.55-$6.70 range; vol contraction indicates a coiled spring setup where the Sep 8-11 data cluster likely triggers 3-5% directional expansion, with the $6.55 support and $6.70 resistance defining the immediate trading envelope
Seasonal Context
Historical seasonal patterns for COMEX copper offer no strong directional signal in September 2026 (48% win rate). Restocking ahead of Q4 production.
Week Ahead Outlook
The next major catalyst is China Balance of Trade (Aug) and Exports YoY (Aug) at 03:00 UTC — estimate trade balance 120.1B vs prior 112.5B, exports est 23.9% YoY vs prior 23.9%; critical demand signal for world's ~50% copper consumer with sequential trade surplus expansion potentially validating robust export-driven industrial demand on Tuesday 8 September — a high-impact event that could materially shift the directional picture.
For copper, the balance between existing momentum and scheduled risk events sets the stage for the week ahead.
This analysis covers one dimension. Our full weekly report combines six specialist agents into a single actionable briefing with directional bias, key levels, and risk-opportunity matrix.
Start Free — Get the Market of the WeekFree weekly report · No credit card · Upgrade anytime


