Copper COT & Institutional Positioning — Smart Money Analysis
Copper institutional positioning: COT data, sentiment analysis and smart money flow assessment.
Copper institutional positioning: COT data, sentiment analysis and smart money flow assessment.
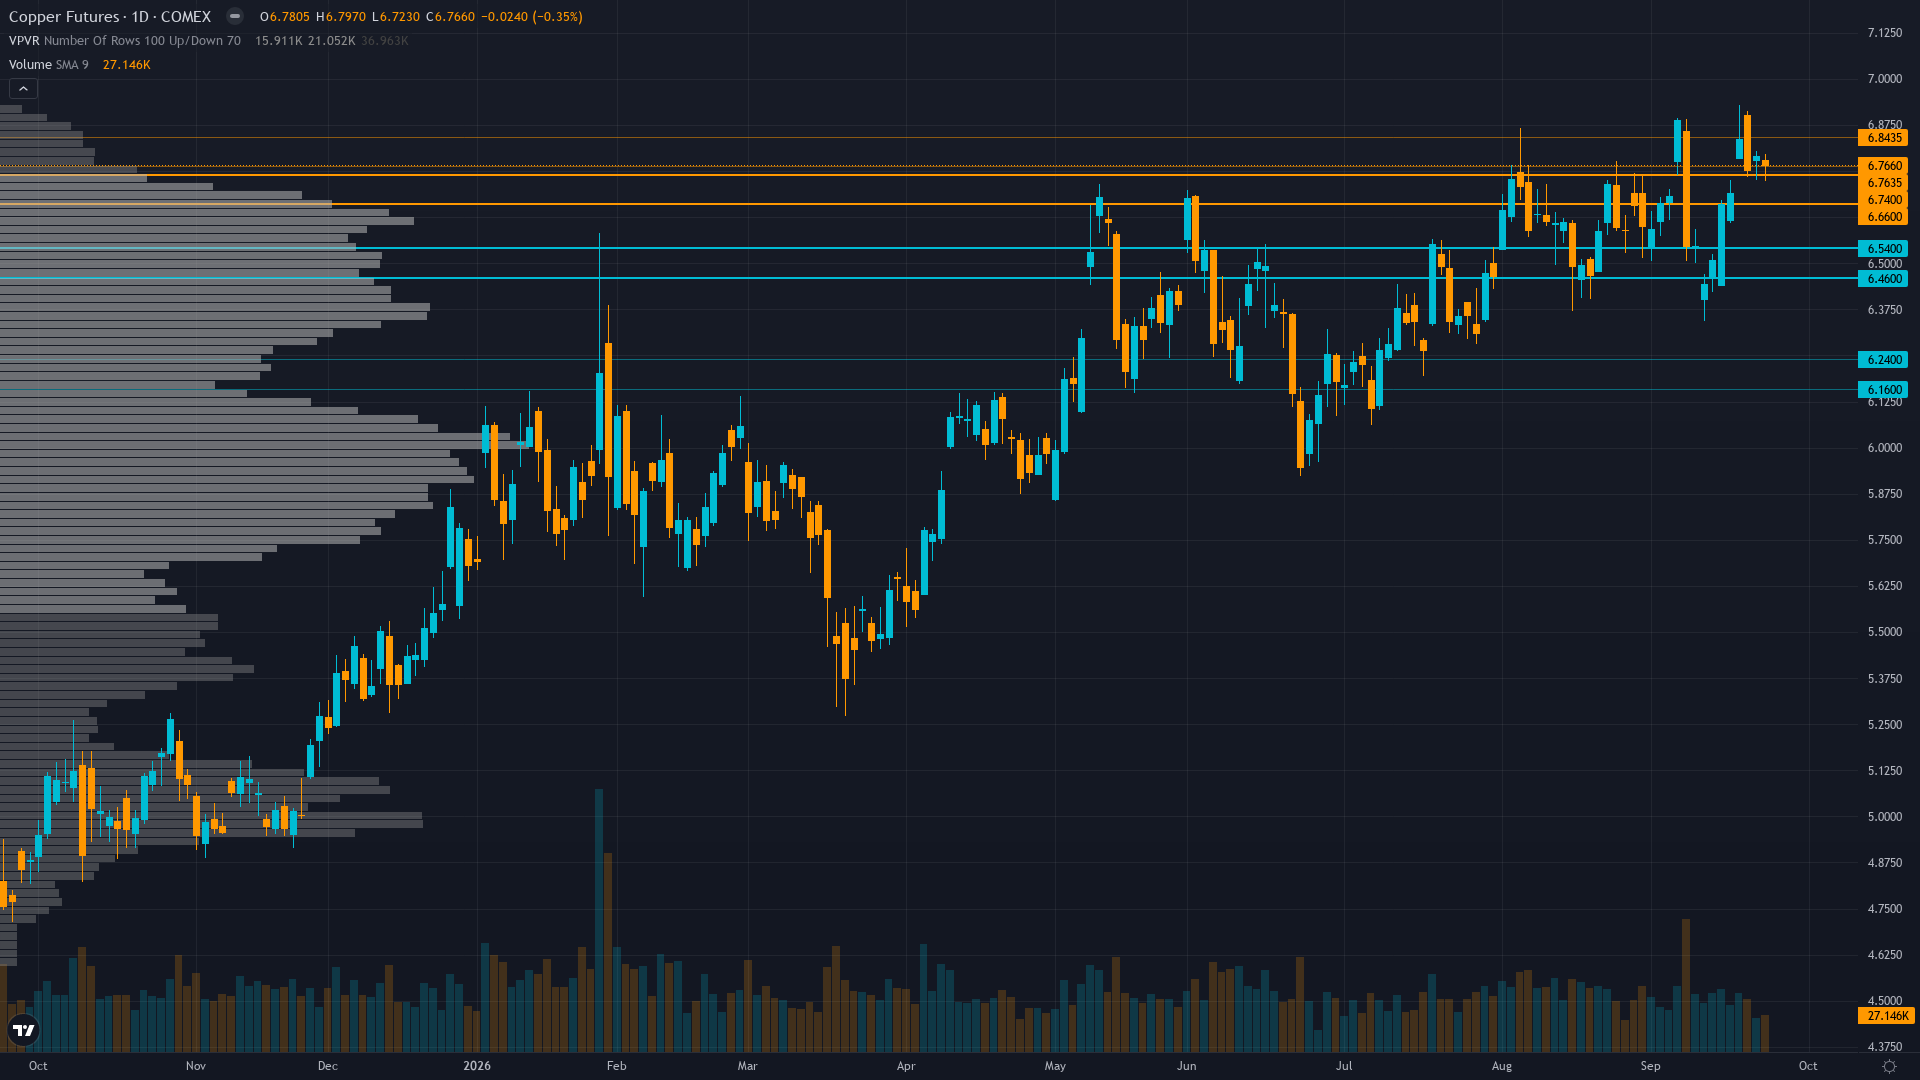
Copper key levels breakdown: support zones, resistance zones, confluence and price structure.
This week's Copper outlook: key drivers, volatility context, risk-opportunity assessment and the week ahead.
Extended
Copper at record highs supported by structural supply deficit and fresh Chilean labour disruption catalysts but extreme COT speculative positioning at 98.7th percentile creates acute binary risk into the Escondida strike vote
This week's Copper outlook: key drivers, volatility context, risk-opportunity assessment and the week ahead.
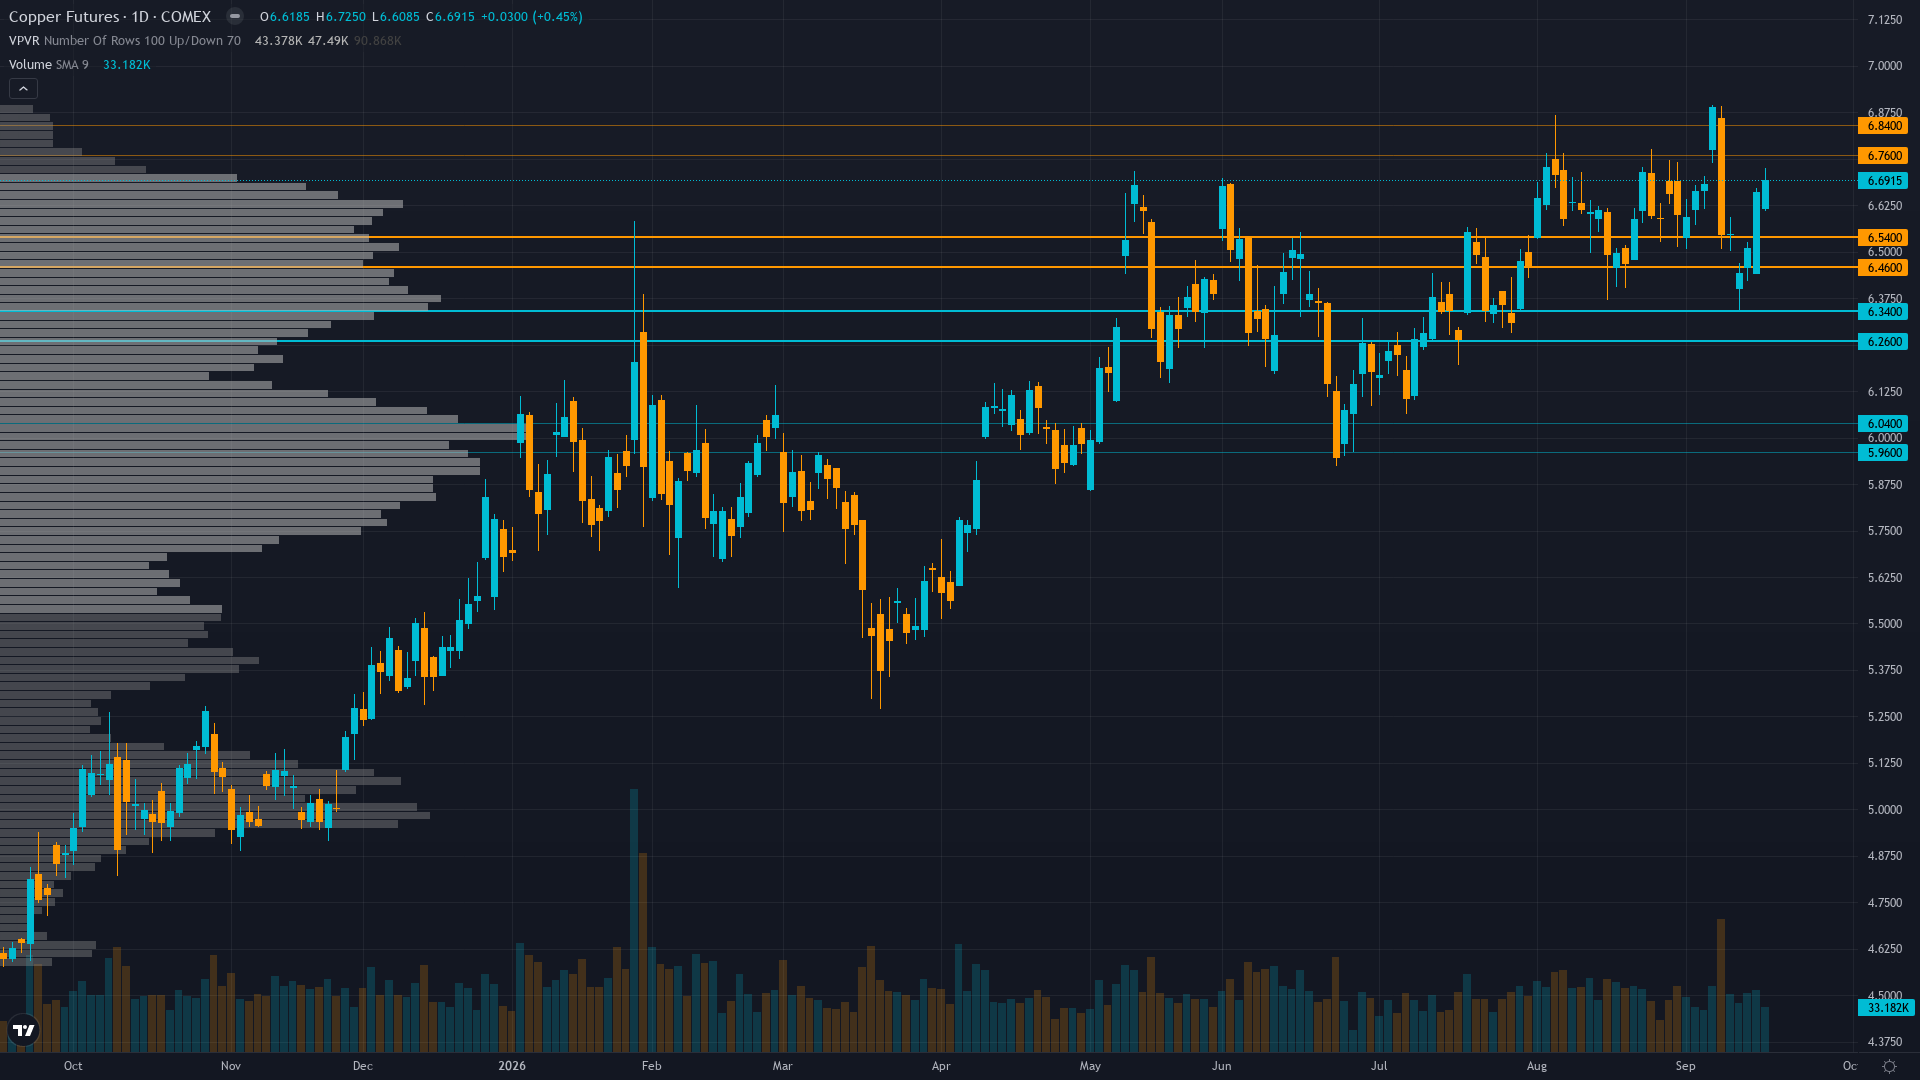
Copper key levels breakdown: support zones, resistance zones, confluence and price structure.
Copper institutional positioning: COT data, sentiment analysis and smart money flow assessment.
Extended
Copper trading near all-time nominal highs supported by structural supply deficit and El Niño production disruptions, but consolidating after the Fed's 25bp rate hike and tariff uncertainty with COT de-risking from extreme levels and LME stocks rising modestly
Copper institutional positioning: COT data, sentiment analysis and smart money flow assessment.
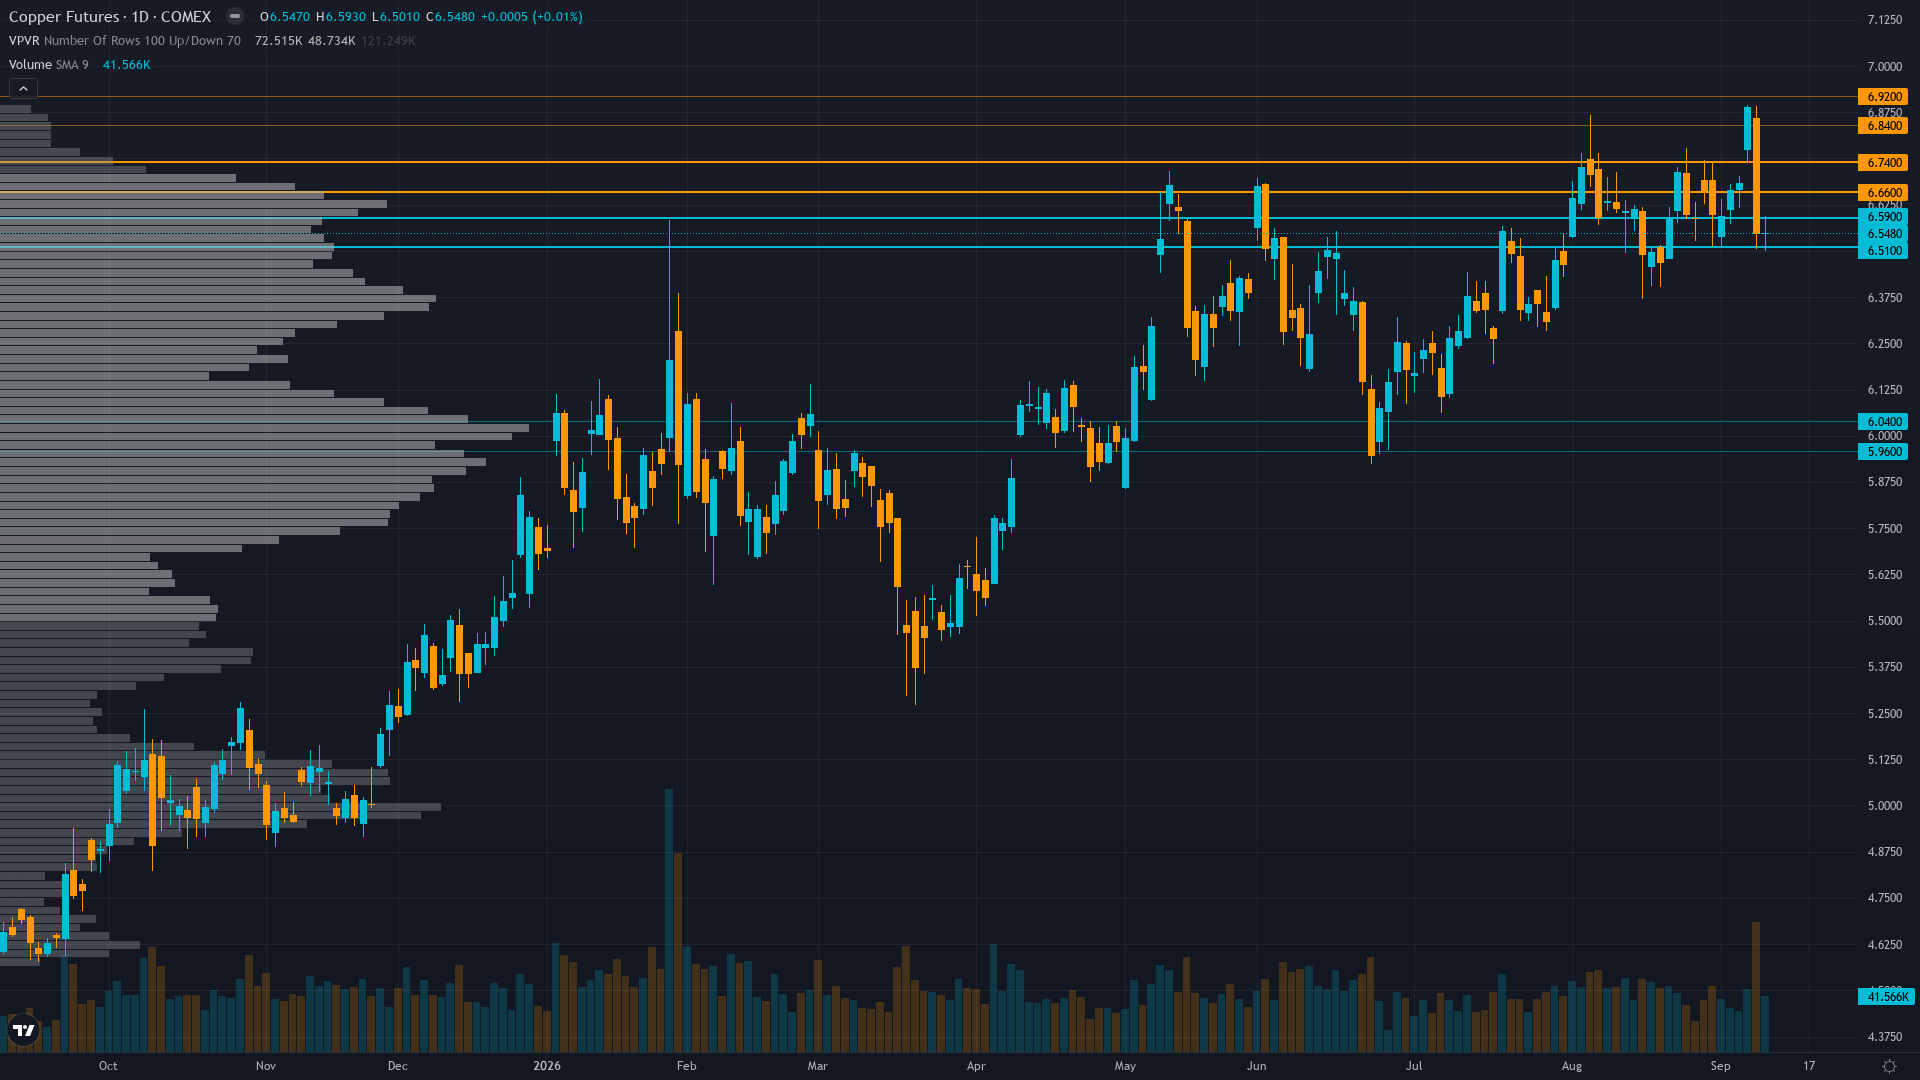
Copper key levels breakdown: support zones, resistance zones, confluence and price structure.
This week's Copper outlook: key drivers, volatility context, risk-opportunity assessment and the week ahead.
Extended
Copper consolidating near record highs supported by US tariff expansion fears driving supply squeeze premium and structural deficit fundamentals, but extreme COT positioning at 99.4th percentile all-time high and imminent China data/FOMC catalyst cluster creating acute binary event risk for the week