S&P 500 Forecast This Week — Outlook, Drivers & Key Levels
This week's S&P 500 outlook: key drivers, volatility context, risk-opportunity assessment and the week ahead.

Where Things Stand
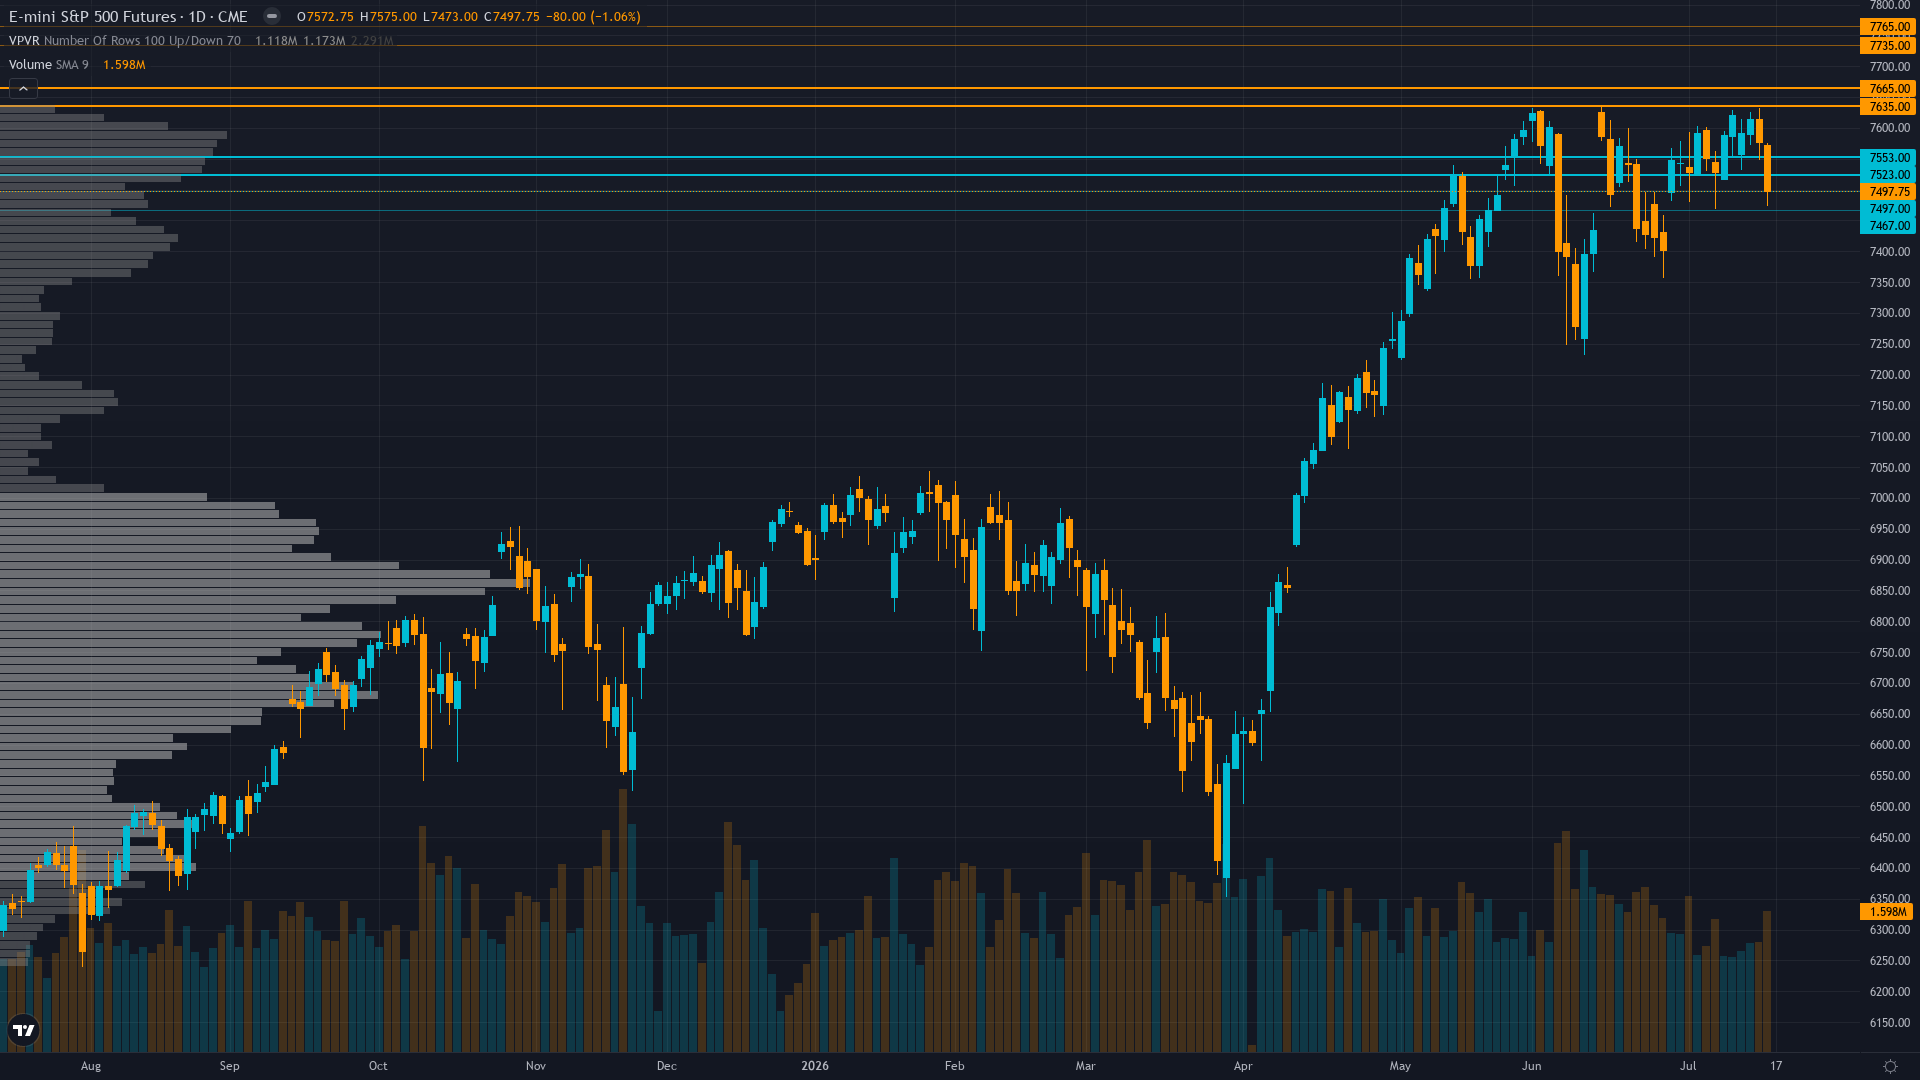
S&P 500 fell to 7495.75 on a 1.65% decline, with selling pressure dominating price action. S&P 500 futures is consolidating, with price compressing into a narrower range as the market builds energy for its next move.
Cautiously bullish on Q2 earnings strength beginning to validate expectations but increasingly aware only 10% of companies reported through July 17 leaving 90% of validation ahead, expecting consolidation in 7,450-7,550 range into July 28-29 FOMC with breakout above 7,600 dependent on earnings execution
What's Driving Price
Primary driver: ES consolidates at 7,495.75 after -1.74% weekly decline from 7,620.25 following VIX spike to 18.77 on July 17 (+12.19% single-session) that created brief fear episode now subsiding, as Q2 earnings season reaches only 10% completion through July 17 with 23.3% growth rate confirmed but 90% of companies yet to report creating fundamental uncertainty into July 28-29 FOMC binary catalyst
Secondary factor: Last week's July 17 BULLISH call at conviction 6 delivered MISSED result (-1.74% move against bias) creating 1-consecutive-miss penalty, while measured calibration shows INDEX/BOND class mid-band conviction (≤7) at 74% accuracy historically suggesting appropriate restraint, yet current setup shows weak -0.5 signal falling BELOW Min Signal 1.0 threshold after four disciplines split creating fundamental directional ambiguity
Additional influence: Technical structure deteriorating with ES at 7,495.75 now only +0.3% above 50-day MA 7,473 (previous week +0.8%) showing compression toward support after testing 7,538.50 intraday high July 19 failed to sustain breakout, while breadth remains weak and VIX 18.77 spike July 17 suggests institutional caution developing despite subsequent compression back to 15.67-16 range
Economic backdrop: Fed at 3.50-3.75% with July 28-29 FOMC (9 days away) pricing 95-98% hold probability per Polymarket but June dot plot revealed hawkish shift with median projection 3.8% end-2026 up from 3.4% creating higher-for-longer narrative, May NFP beat and ISM Manufacturing 54.0 expansion support soft landing but policy communication uncertainty persists
Fundamental assessment: Forward PE 20.3-20.88x moderately overvalued at 11-15% premium to historical 18.2x median, justified only if Q2 earnings season validates 23.3% growth trajectory but FactSet July 17 data shows only 10% of companies reported through that date leaving 90% of validation ahead, creating execution risk over next 2-3 weeks
Chart Assessment
Weakening uptrend with ES 7,495.75 compressed to +0.3% above 50-day MA 7,473 from prior week +0.8%, still above 200-day MA 7,403 but momentum decaying after July 17 VIX spike to 18.77 marked brief fear episode, RSI ~60 neutral territory, resistance cluster 7,540-7,600 unbreached creating consolidation pattern
With trend strength at 6/10, there's a clear directional tilt but room for the move to develop further.
Risk & Opportunity
Primary risk: Q2 earnings season validation fails as remaining 90% of companies reporting through late July disappoint 23.3% growth expectations or margin guidance weakens from record levels, triggering multiple compression from forward PE 20-21x elevated valuations while crowded institutional long positioning (34.4% of OI) unwinds testing 7,473 then 7,400 support as July 28-29 FOMC delivers hawkish hold language (Probability: medium)
Primary opportunity: Brief consolidation resolves higher as remaining Q2 earnings reports through late July validate 23.3% growth trajectory enabling breakout above 7,540-7,600 resistance toward 7,650-7,700 psychological levels if July 28-29 FOMC maintains accommodative bias despite hawkish dot plot and VIX compression below 15 creates chase dynamics (Timeframe: July 22-August 5 2026)
This week's edge: Below Min Signal threshold—directional edge insufficient for bias. Market may be underestimating execution risk with only 10% of Q2 earnings reported through July 17 while forward PE 20.3-20.88x prices in full 23.3% growth validation, and July 17 VIX spike to 18.77 (+12.19%) though quickly reversed suggests latent institutional caution developing beneath surface calm that consensus dismisses. Crowded institutional long positioning at 34.4% of open interest combined with Q2 earnings blackout removing buyback support creates structural vulnerability over next 2-3 weeks until earnings clarity emerges.
Volatility Backdrop
ES futures volatility at the 55th percentile reflects a balanced environment where standard risk parameters apply. Volatility remains anchored at current levels, with no clear signal of an imminent regime shift in either direction.
Normal volatility regime suggests 1.0-1.5% daily ES moves expected with July 19 intraday range 7,473-7,538.50 representing 0.87% width confirming contained regime—Q2 earnings season 90% incomplete through July 17 and July 28-29 FOMC 9 days away present asymmetric expansion risk with potential 2-3% intraday swings on major surprises either direction
The Week Ahead
FOMC two-day meeting July 28-29 with statement release 2:00 PM ET July 29 represents first major policy catalyst after Q2 earnings season peak weeks, markets scrutinizing forward guidance after June dot plot hawkish shift and Chair Warsh debut period creates policy trajectory uncertainty on Tuesday 28 July is a high-impact catalyst with the potential to redefine the near-term outlook entirely.
How S&P 500 navigates the confluence of consolidating conditions and incoming data will determine whether the current directional thesis holds or breaks.
This analysis covers one dimension. Our full weekly report combines six specialist agents into a single actionable briefing with directional bias, key levels, and risk-opportunity matrix.
Start Free — Get the Market of the WeekFree weekly report · No credit card · Upgrade anytime



