Russell 2000 COT & Institutional Positioning — Smart Money Analysis
Russell 2000 institutional positioning: COT data, sentiment analysis and smart money flow assessment.

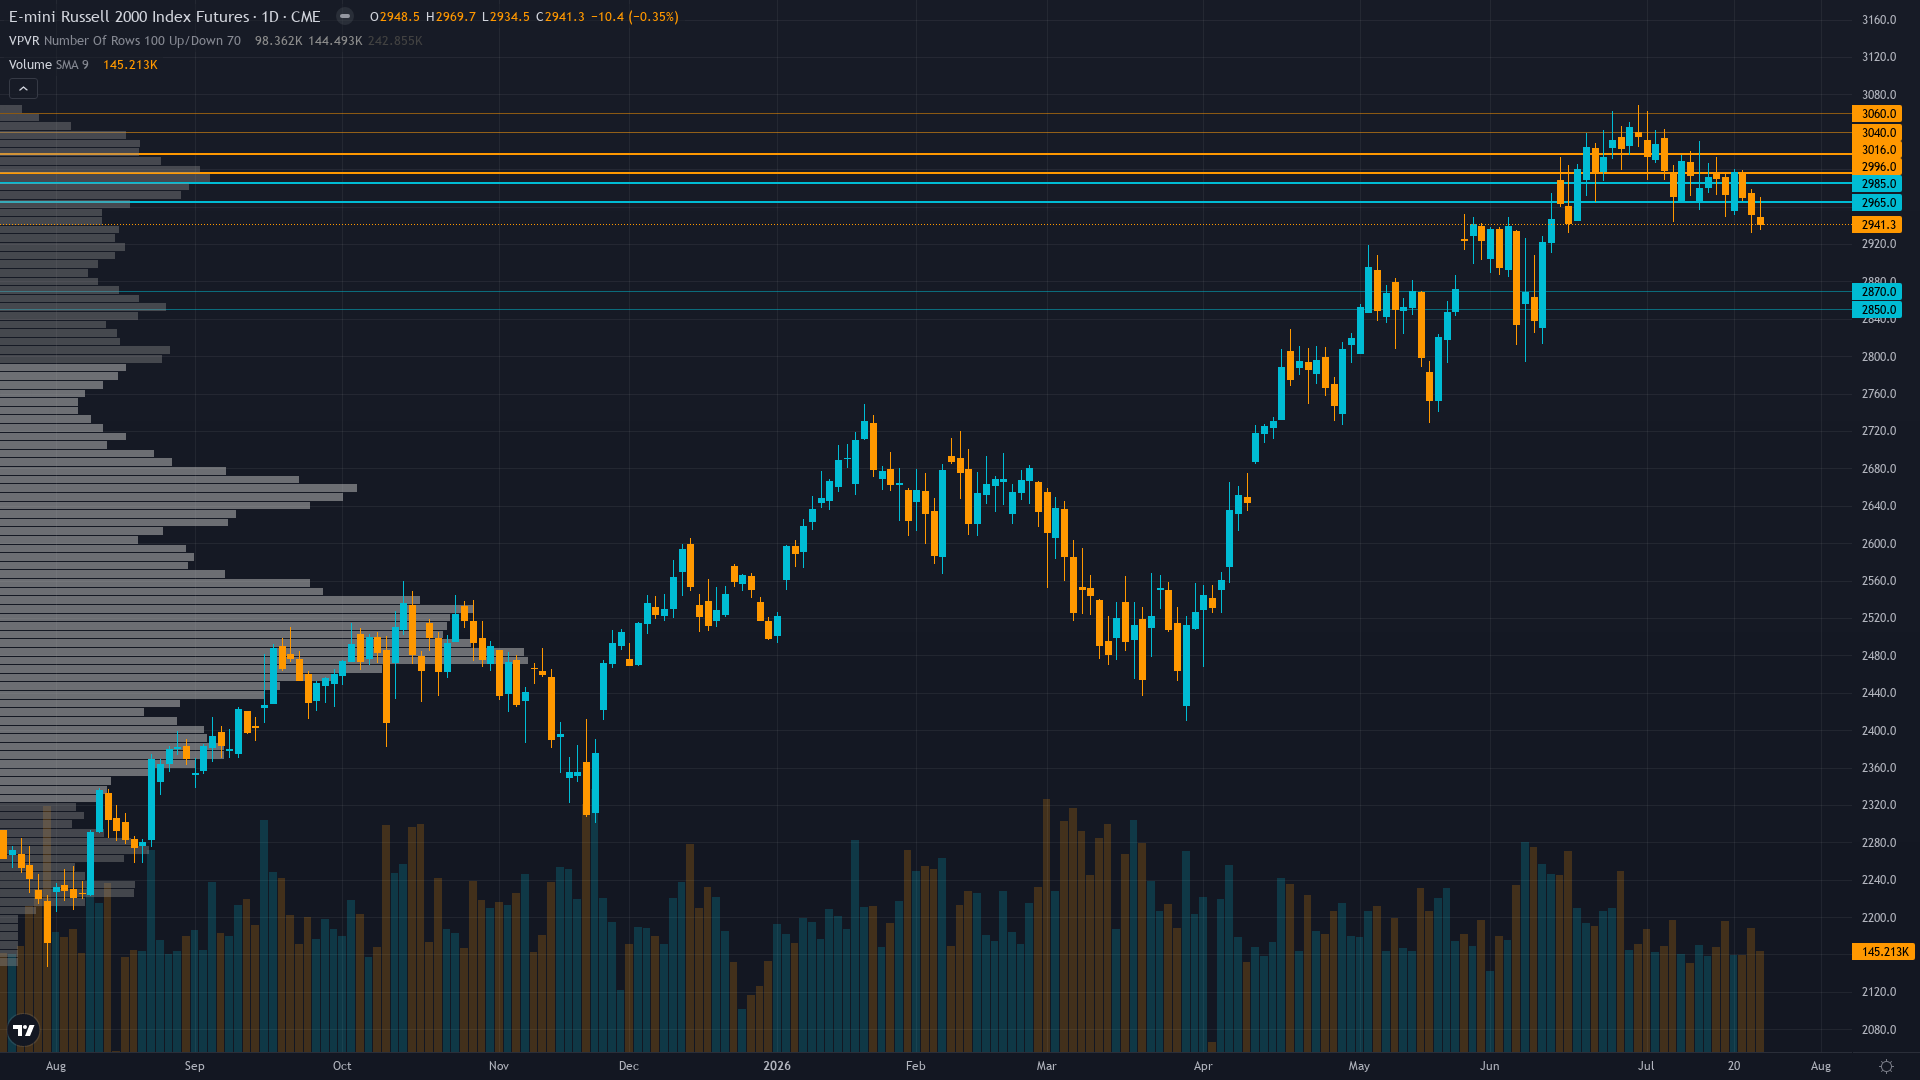
Where Institutions Stand
Russell 2000 holds at 2946.9, up a marginal 0.19% as the market grinds forward.
Stale February COT data limits real-time visibility but June 26 reconstitution flows exhausted one month ago removing mechanical bid, persistent IWM outflows throughout 2026 despite YTD gains signal institutional distribution pattern continuing, quarter-end July 31 rebalancing flows 5 days away create modest technical support but insufficient to override fundamental headwinds
Sentiment Analysis
Positioning in Russell 2000 futures is balanced, with neither bulls nor bears holding a decisive edge. Neutral sentiment typically precedes a directional catalyst.
Derivatives Intelligence
VIX at 16.64 near 52-week low of 13.38 signals extreme complacency with equity put/call at 0.61 showing minimal defensive hedging despite 3.4% decline from ATH, creating dangerous divergence where call demand dominates without panic protection as markets consolidate ahead of binary FOMC event creating latent volatility expansion risk
Consensus Check
Market consensus: Small-caps consolidating 3.4% below July 1 all-time high at 3,050 with market positioned for July 28-29 FOMC to provide policy clarity, maintaining cautious outlook ahead of binary Fed event with mixed positioning as VIX complacency contradicts retail AAII bearish swing
Primary driver: July 28-29 FOMC meeting 2 days away represents dominant binary catalyst with market pricing 75% no-change vs 25% hike probability per Polymarket, creating acute policy uncertainty for credit-sensitive small-caps where 31% EBITDA goes to interest expense making RTY uniquely vulnerable to hawkish surprise or guidance shift
Positioning Summary
Putting the positioning picture together for small-cap futures: sentiment is fear, trend strength at 4/10 paints a picture of a market with some direction but lacking strong conviction. The net assessment from institutional data, crowd positioning, and derivatives activity points to a market where the balance of forces tilts in a discernible direction.
This analysis covers one dimension. Our full weekly report combines six specialist agents into a single actionable briefing with directional bias, key levels, and risk-opportunity matrix.
Start Free — Get the Market of the WeekFree weekly report · No credit card · Upgrade anytime



