S&P 500 Forecast This Week — Outlook, Drivers & Key Levels
This week's S&P 500 outlook: key drivers, volatility context, risk-opportunity assessment and the week ahead.

Where Things Stand
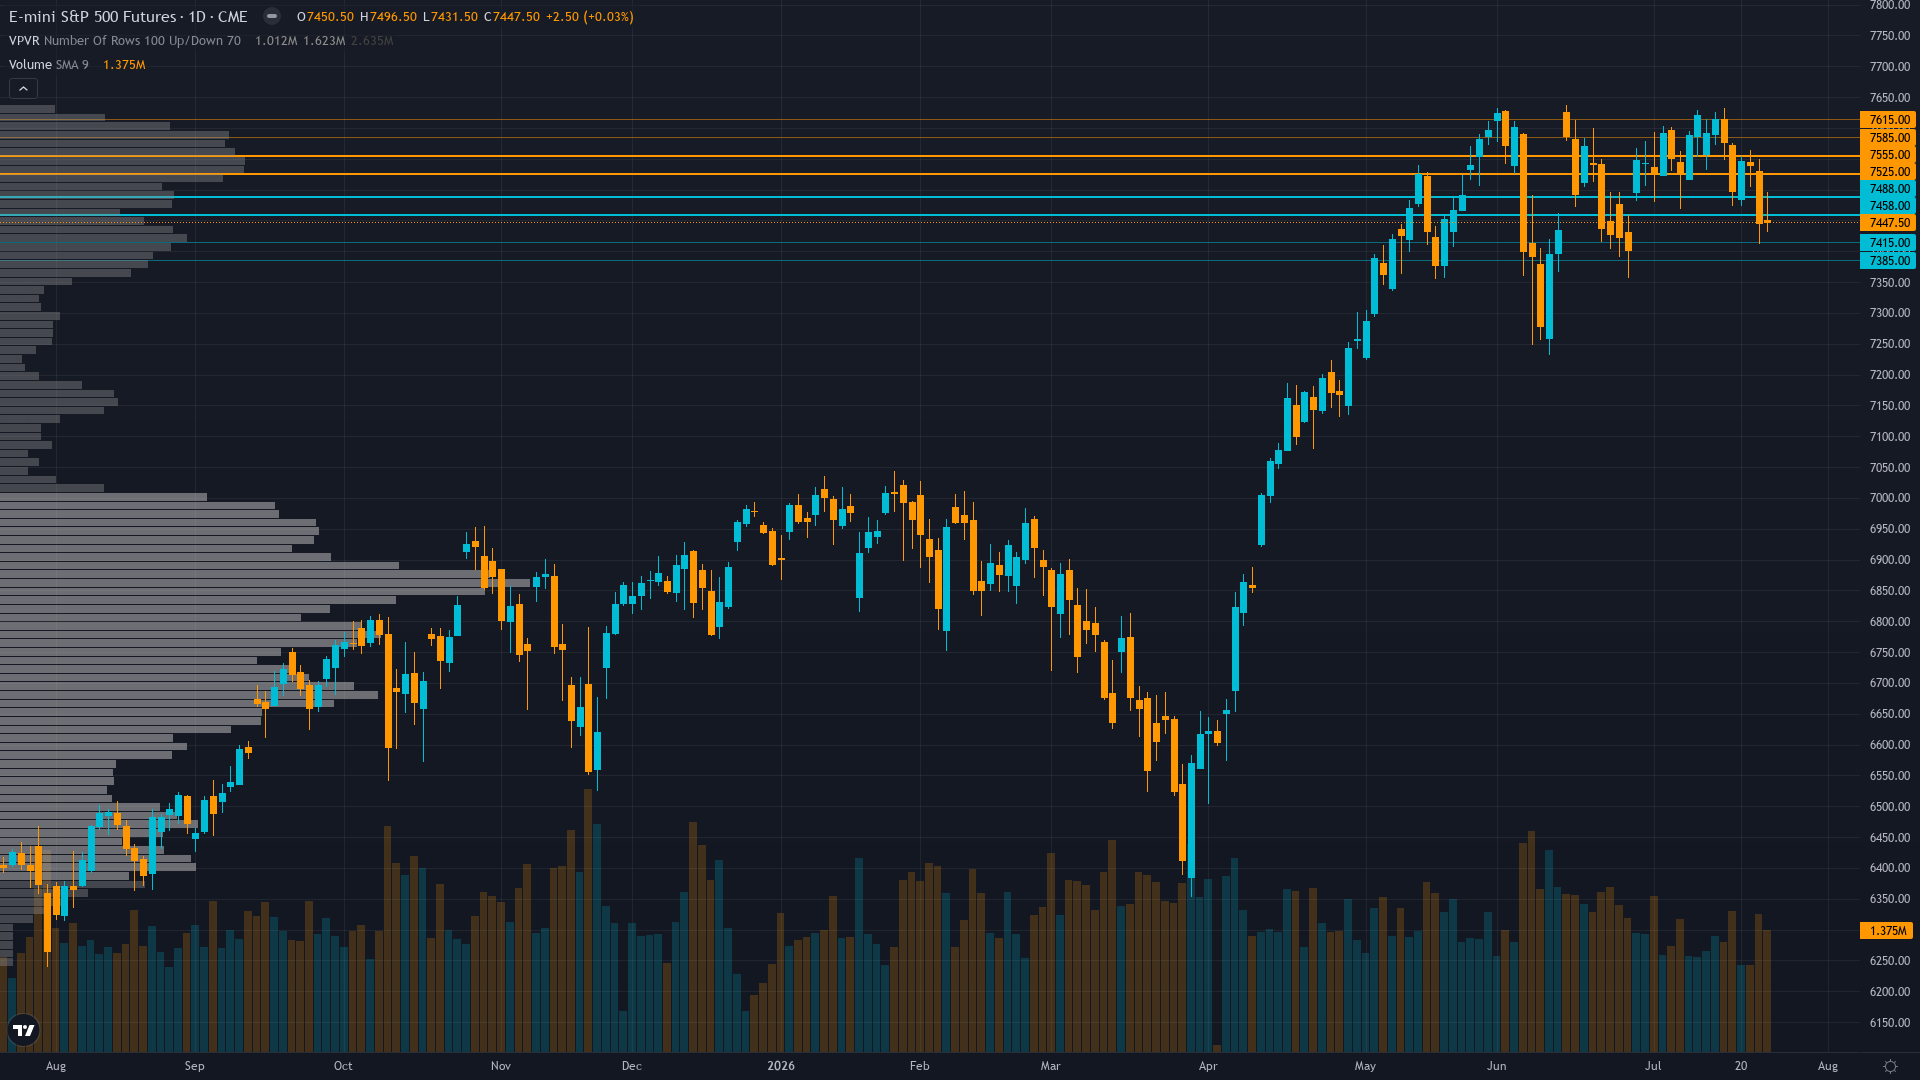
Trading at 7447.5 with a 0.03% uptick, S&P 500 is drifting higher without strong conviction. S&P 500 futures is consolidating, with price compressing into a narrower range as the market builds energy for its next move.
Divided between oversold bounce buyers targeting 7,500-7,540 relief rally into FOMC and breakdown sellers expecting 7,319-7,200 continuation if Fed delivers hawkish surprise, with majority positioning cautiously ahead of July 29 binary outcome while acknowledging Q2 earnings validation creates fundamental support
What's Driving Price
Primary driver: ES consolidates at 7,447.50 between 50-day MA 7,506 and 200-day MA 7,479 after -2.36% weekly decline from 7,620 high creating technical damage, as July 28-29 FOMC binary catalyst 3 days away converges with Fed rate hike probability surging to 31% from 13% per Bloomberg while Q2 earnings season 88% beat rate validates 23.3% growth but only creates noise-level price response
Secondary factor: Schwab reports markets remain jittery over AI spending concerns despite earnings strength, with Alphabet hiking 2026 capex to $195-205B creating sector-specific volatility as 10Y yields near 4.67% weigh on tech multiples creating concentration risk for S&P 500 composition
Additional influence: Technical breakdown confirmed with RSI 33.5 oversold marking deepest reading since March fear capitulation creating mean-reversion potential, yet price trading below both 50-day and 200-day MAs for first time in current cycle represents structural trend reversal from May-June all-time highs at 7,617
Economic backdrop: Fed at 3.50-3.75% with July 28-29 FOMC 3 days away pricing 75% hold but hike probability surged to 31% from 13% per Bloomberg creating hawkish repricing risk, ISM Manufacturing 55.7 strongest expansion in 4 years removes dovish catalyst while recession probability only 11%
Fundamental assessment: Forward PE 19.78x at fair value justified by Q2 earnings 88% beat rate delivering 23.3% growth with record margins, but elevated AI capex concerns ($195-205B Alphabet alone) create sector concentration vulnerability as top 7 stocks represent 40% of index weight
Chart Assessment
Critical breakdown - ES 7,447.50 trading below 50-day MA 7,506 (-0.8%) and 200-day MA 7,479 (-0.4%) for first time marking structural shift from uptrend to consolidation, RSI 33.5 severely oversold creates reflexive bounce potential yet lower-high/lower-low pattern confirmed
With trend strength at 4/10, the directional signal is present but far from decisive.
Risk & Opportunity
Primary risk: July 29 FOMC delivers hawkish surprise with rate hike or removes accommodative language following manufacturing PMI 55.7 strength and oil price pressures, triggering equity repricing from forward PE 19.78x levels as technical breakdown below both major MAs accelerates toward 7,319 then 7,200 support testing 200-day conviction (Probability: medium)
Primary opportunity: RSI 33.5 severe oversold triggers 3-5 day capitulation bounce toward 7,500-7,540 resistance if July 29 FOMC maintains accommodative bias despite manufacturing strength and remaining Q2 earnings reports through month-end validate 23.3% growth trajectory enabling VIX compression below 16 (Timeframe: July 29 - August 5 2026)
This week's edge: Signal below Min Signal 1.0 threshold requires NO CALL per Rule 2 - directional edge insufficient despite July 29 FOMC catalyst. Market may be underestimating significance of Fed hike probability surge to 31% from 13% per Bloomberg creating hawkish repricing ahead of July 29 meeting while overestimating Q2 earnings support given AI spending concerns ($195-205B Alphabet capex) create sector concentration vulnerability consensus dismisses
Volatility Backdrop
ES futures volatility at the 54th percentile reflects a balanced environment where standard risk parameters apply. Volatility remains anchored at current levels, with no clear signal of an imminent regime shift in either direction.
Normal volatility regime suggests 1.0-1.5% daily ES moves expected with current consolidation creating coiled setup - July 29 FOMC binary outcome presents asymmetric expansion risk with potential 2-3% intraday swings on policy surprise either direction while technical inflection at 200-day MA creates decision point
The Week Ahead
FOMC statement release 2:00 PM ET July 29 represents first major policy catalyst after Q2 earnings season, markets scrutinizing whether Fed acknowledges manufacturing strength and oil price pressures that drove hike probability to 31% or maintains accommodative bias on Wednesday 29 July is a high-impact catalyst with the potential to redefine the near-term outlook entirely.
How S&P 500 navigates the confluence of consolidating conditions and incoming data will determine whether the current directional thesis holds or breaks.
This analysis covers one dimension. Our full weekly report combines six specialist agents into a single actionable briefing with directional bias, key levels, and risk-opportunity matrix.
Start Free — Get the Market of the WeekFree weekly report · No credit card · Upgrade anytime



