Nasdaq 100 Forecast This Week — Outlook, Drivers & Key Levels
This week's Nasdaq 100 outlook: key drivers, volatility context, risk-opportunity assessment and the week ahead.

Current Market Picture
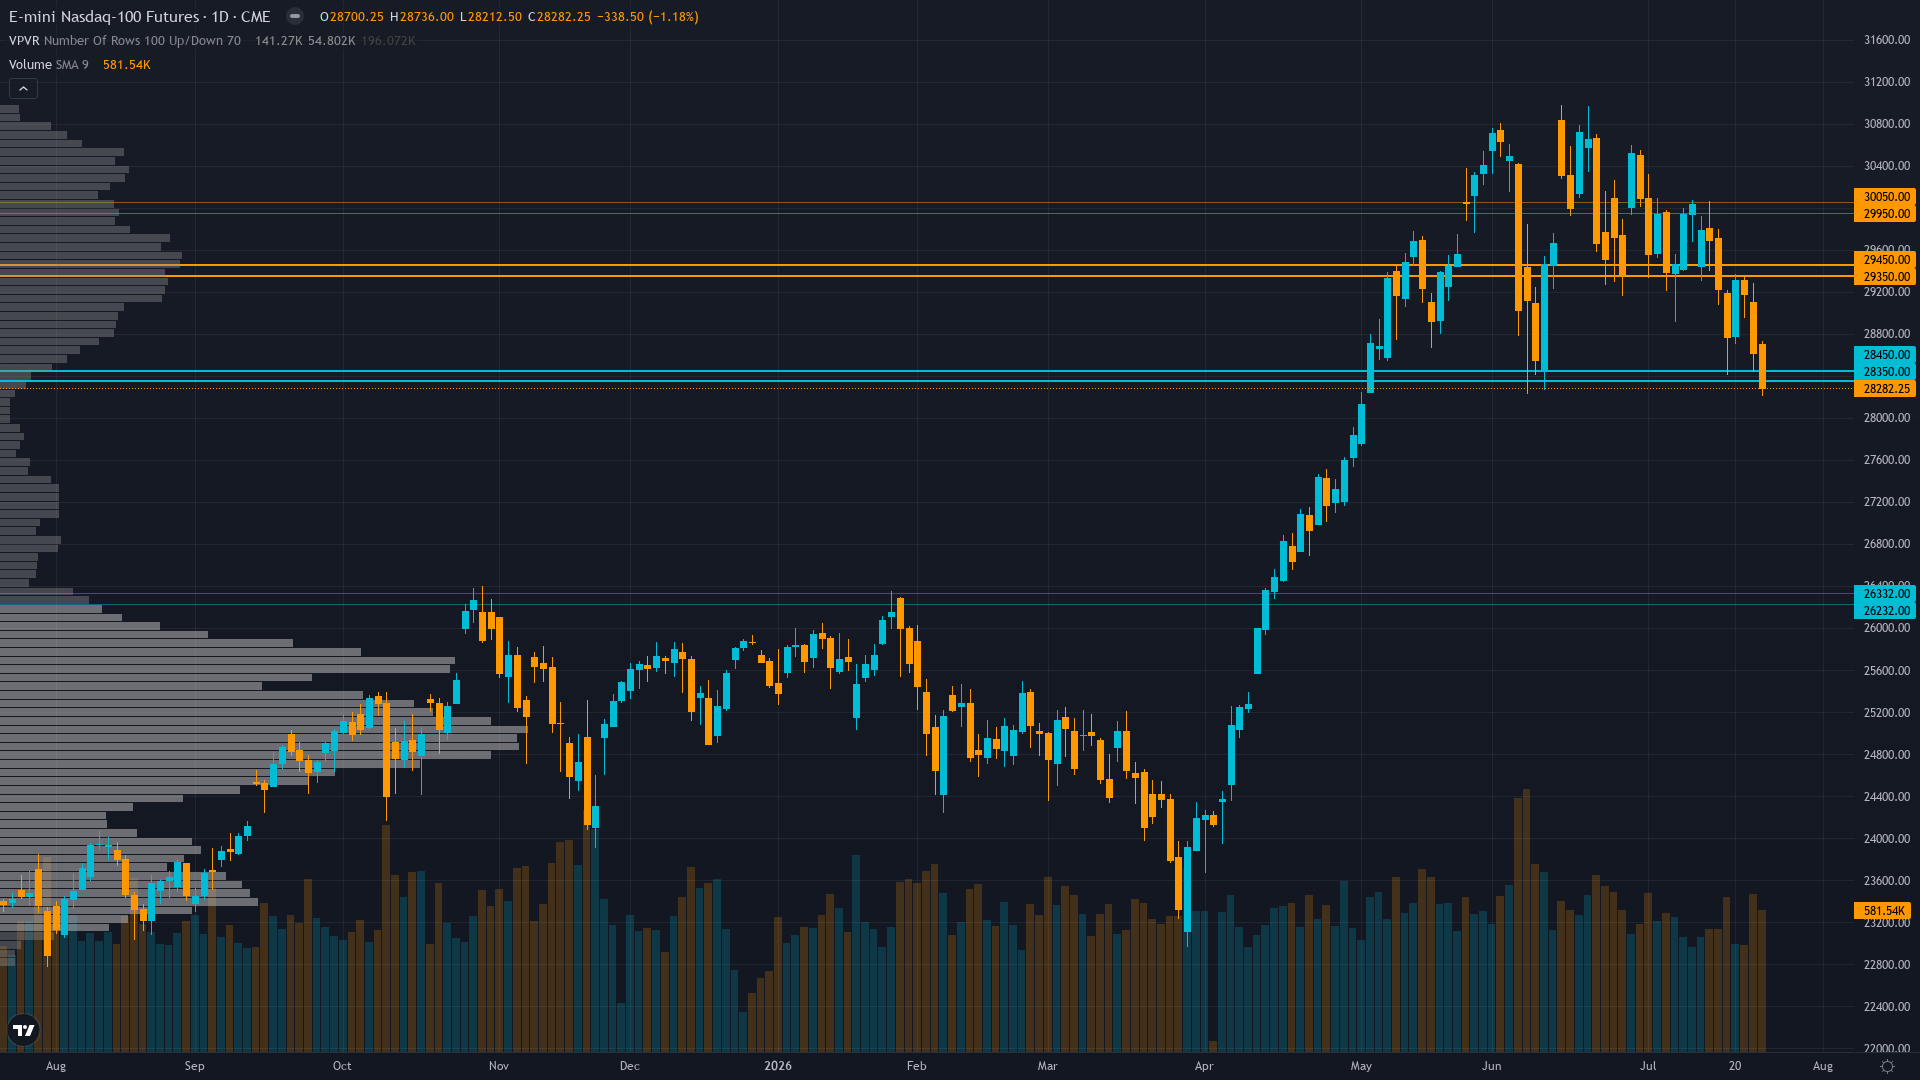
Nasdaq 100 is trading at 28282.25, down 1.18% as selling pressure weighs on price. Nasdaq 100 futures is in a breaking down market state, requiring careful assessment of current conditions.
Defensively positioned ahead of July 29 FOMC acknowledging 25% hike probability from oil surge and inflation persistence, cautious on elevated valuations requiring Q2 earnings validation, but divided on whether technical breakdown represents genuine trend reversal or tactical selloff before event clarity
Key Drivers This Week
Primary driver: July 28-29 FOMC meeting (3 days away) with markets pricing 75% hold probability but 25% hike probability per Polymarket, representing hawkish repricing from oil surge above $100 and May CPI 4.2% inflation persistence, creating binary event risk ahead of Wednesday 2:00 PM ET announcement
Secondary factor: Technical breakdown structure confirmed with NQ at 28,282 decisively below 50-day MA (29,373) and 200-day MA (29,538) after sustained decline through July, with RSI 32.49 oversold but downtrend momentum intact on elevated volume
Additional influence: Q2 2026 earnings season underway with mega-cap tech reporting July 22-30 providing fundamental validation test, P/E 30.38 moderately elevated requiring execution, $725B AI capex sustainability questioned after chip sector volatility
Economic backdrop: Fed held at 3.5-3.75% with July 28-29 FOMC critical, Polymarket shows 75% hold/25% hike after oil surge above $100 and persistent inflation, no SEP this meeting increases press conference importance, ISM Manufacturing 52.7 expansionary, AI capex $725B structural support
Fundamental assessment: P/E 30.38 moderately elevated (5% above long-term average 28.93), Q2 earnings underway with major tech July 22-30, $725B AI capex confirmed but monetization evidence needed, forward earnings growth expectations strong but require validation
Price Structure
Confirmed downtrend with price 28,282 below 50-day MA (29,373) and 200-day MA (29,538), RSI 32.49 deeply oversold indicating downside momentum exhaustion potential, volume 581K elevated confirming distribution, breakdown structure active
Trend strength registers just 3/10, which typically corresponds to choppy, directionless price action.
Upside & Downside
Primary risk: Breakdown below 28,212 support accelerates toward 28,000 or lower as July 29 FOMC delivers 25bp hike (25% probability) or hawkish hold language, combining with elevated 30.38x P/E requiring Q2 earnings validation starting July 22 and oil above $100 sustaining inflation pressure forcing Fed hawkish pivot (Probability: medium)
Primary opportunity: Hold above 28,212-28,500 support combined with July 29 FOMC delivering balanced hold without hike and Q2 earnings validating AI capex sustainability drives recovery toward 29,373-29,538 resistance as acute FOMC uncertainty resolves and oversold RSI 32.49 mean-reverts within 5-7 day typical pattern (Timeframe: 1-2 weeks as July 29 FOMC provides policy clarity and late-July mega-cap earnings (MSFT/Meta 7/29, AAPL/AMZN 7/30) deliver fundamental validation, with historical 70% probability FOMC volatility settles within 3-5 days if outcome aligns with consensus)
This week's edge: Market may be underweighting speed at which July 29 FOMC 25% hike probability (up from near-zero weeks ago per news sources) removes duration-sensitive tech support at 30.38x P/E while oil above $100 sustains inflation pressure, but overweighting near-term oversold RSI 32.49 as mean-reversion opportunity when binary event risk remains unresolved until Wednesday 2:00 PM ET
Volatility Context
At the 72th percentile of its 90-day range, NQ futures volatility is running hot, creating both opportunity and risk for directional traders. Realised vol is trending higher across the curve, which tends to accompany transitional periods where the market is repricing risk.
High volatility at 72nd percentile suggests 1.5-1.8x normal daily ranges; expect 375-450 point daily swings versus normal 250-300 ranges; breakouts above 29,373 or breakdowns below 28,212 carry elevated whipsaw risk until July 29 FOMC clarifies policy trajectory, requiring wider stops
Week Ahead Outlook
The next major catalyst is July 28-29 FOMC rate decision announced Tuesday July 29 at 2:00 PM ET with Chair Powell press conference at 2:30 PM, markets pricing 75% hold at 3.5-3.75% and 25% hike probability per Polymarket after oil surge above $100 and persistent inflation, critical for policy trajectory without SEP projections on Wednesday 29 July — a high-impact event that could materially shift the directional picture.
For tech futures, the balance between existing momentum and scheduled risk events sets the stage for the week ahead.
This analysis covers one dimension. Our full weekly report combines six specialist agents into a single actionable briefing with directional bias, key levels, and risk-opportunity matrix.
Start Free — Get the Market of the WeekFree weekly report · No credit card · Upgrade anytime



