Market Of The Week: ★Silver (SI)★ Federal Reserve June 17-18 FOMC meeting expected to hold rates unchanged at…
Silver (SI): Market treating May 12-15 inflation surprise and May 15 -9% selloff as validation of secular bear trend invalidating structural deficit thesis, while desk recognizes this as Fed-driven cyclical consolidation within intact secular bull structure—sixth-year deficit with 59% industrial dem

Market consensus fractured between structural bulls targeting $80-90 recovery by Q3 on intact sixth-year deficit fundamentals and cautious bears projecting $70-75 extended consolidation on Fed restrictive policy and demand deterioration, with CoinCodex and analyst forecasts showing wide dispersion from $50 to $300+ reflecting uncertainty following May inflation surprise
May 12-15 inflation surprise driving 10Y yields to 4.473% and 30Y above 5% creates direct mathematical headwind for non-yielding silver via rising real yields above 2.0%, sustaining dollar strength (DXY 99.31) and overwhelming sixth-year structural deficit fundamentals in near-term price action
Sixth consecutive year of 67M oz structural deficit with 59% industrial demand from solar/EV/AI sectors remains fundamentally intact but increasingly contradicted by emerging demand deterioration evidence (Silver Institute data showing industrial fabrication declining 2% to four-year low from substitution/thrifting trends at elevated price levels)
Extreme retail positioning at 90% long (DailyFX data) creating contrarian bearish overhang while institutional positioning washed out at mid-range 10,039 contracts limits forced liquidation risk but also removes spontaneous upside fuel without catalyst, creating asymmetric setup where downside from crowd capitulation exceeds upside from institutional re-engagement
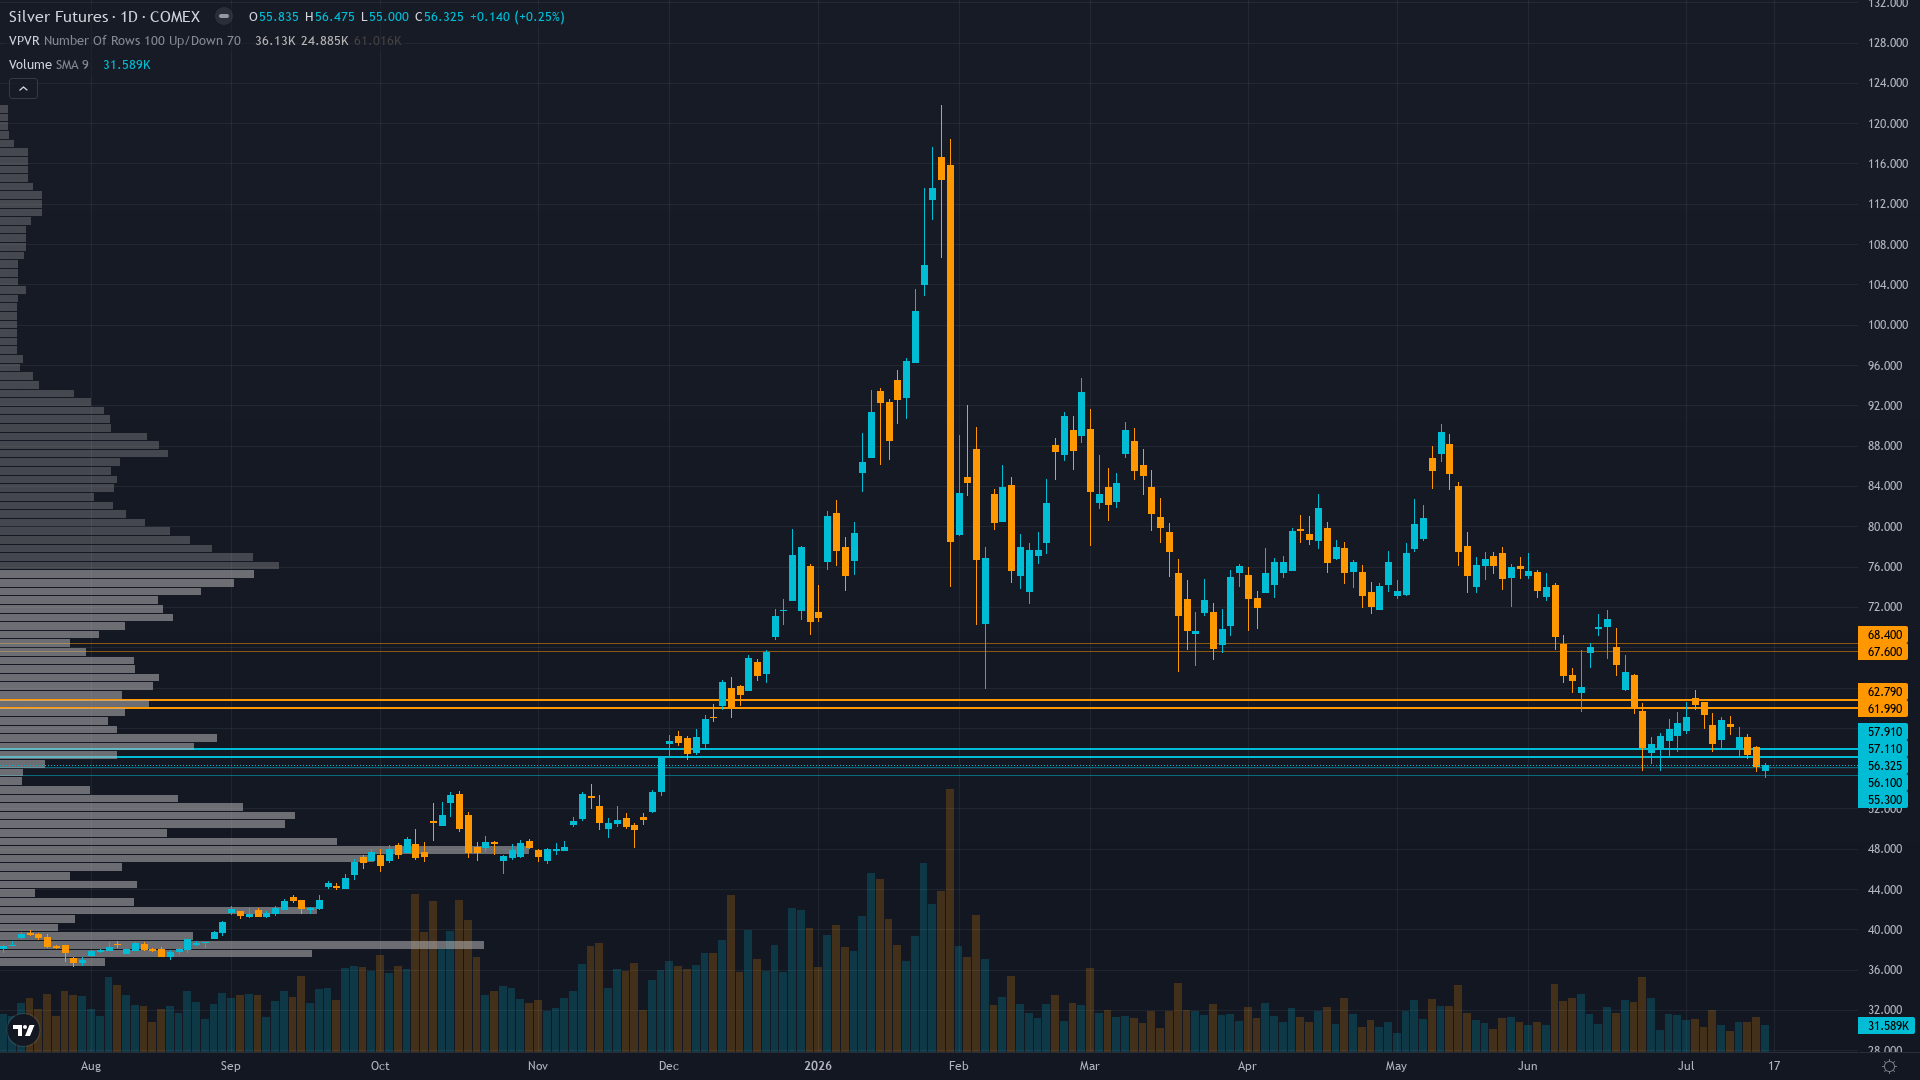
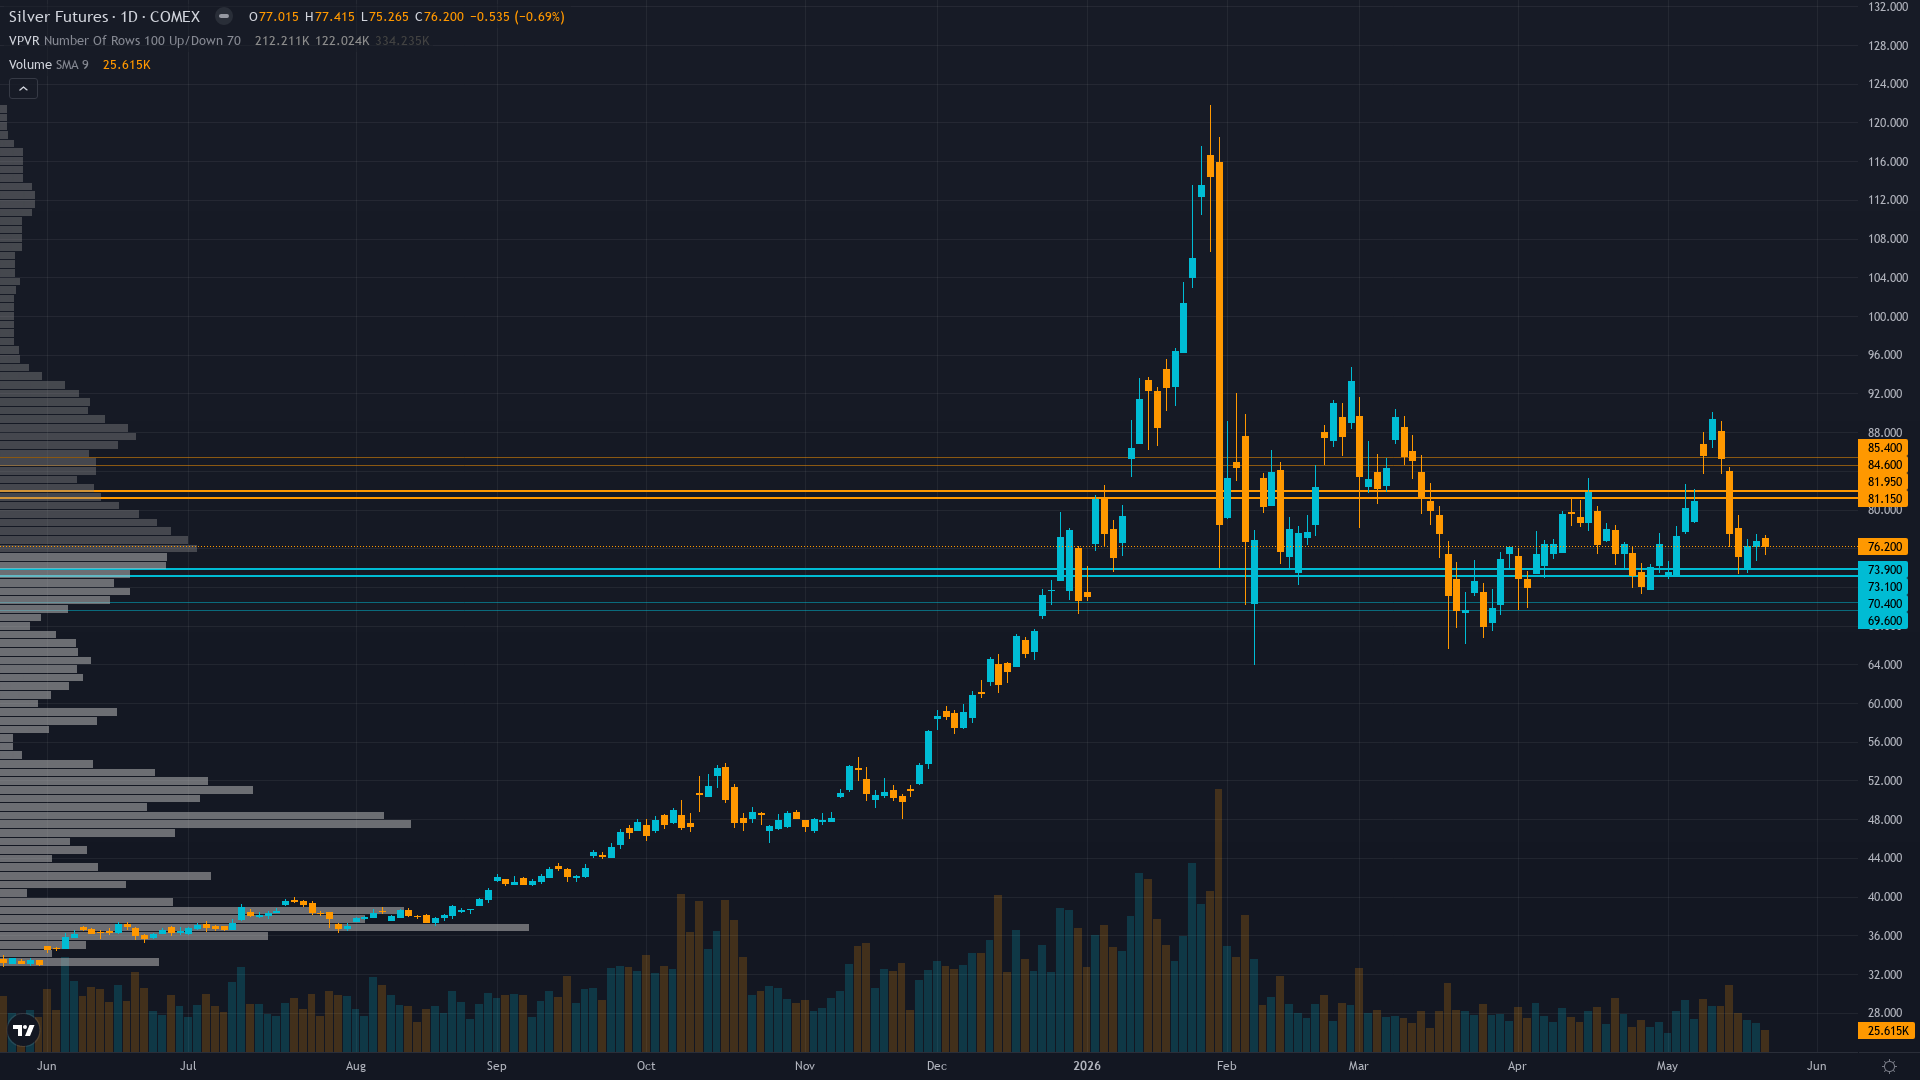
| ▼ Resistance Zone 2 | 80.50 – 83.50 |
| ▼ Resistance Zone 1 | 77.00 – 80.00 |
| ─ Pivot Area | ~76.20 |
| ▲ Support Zone 1 | 72.00 – 75.00 |
| ▲ Support Zone 2 | 68.50 – 71.50 |
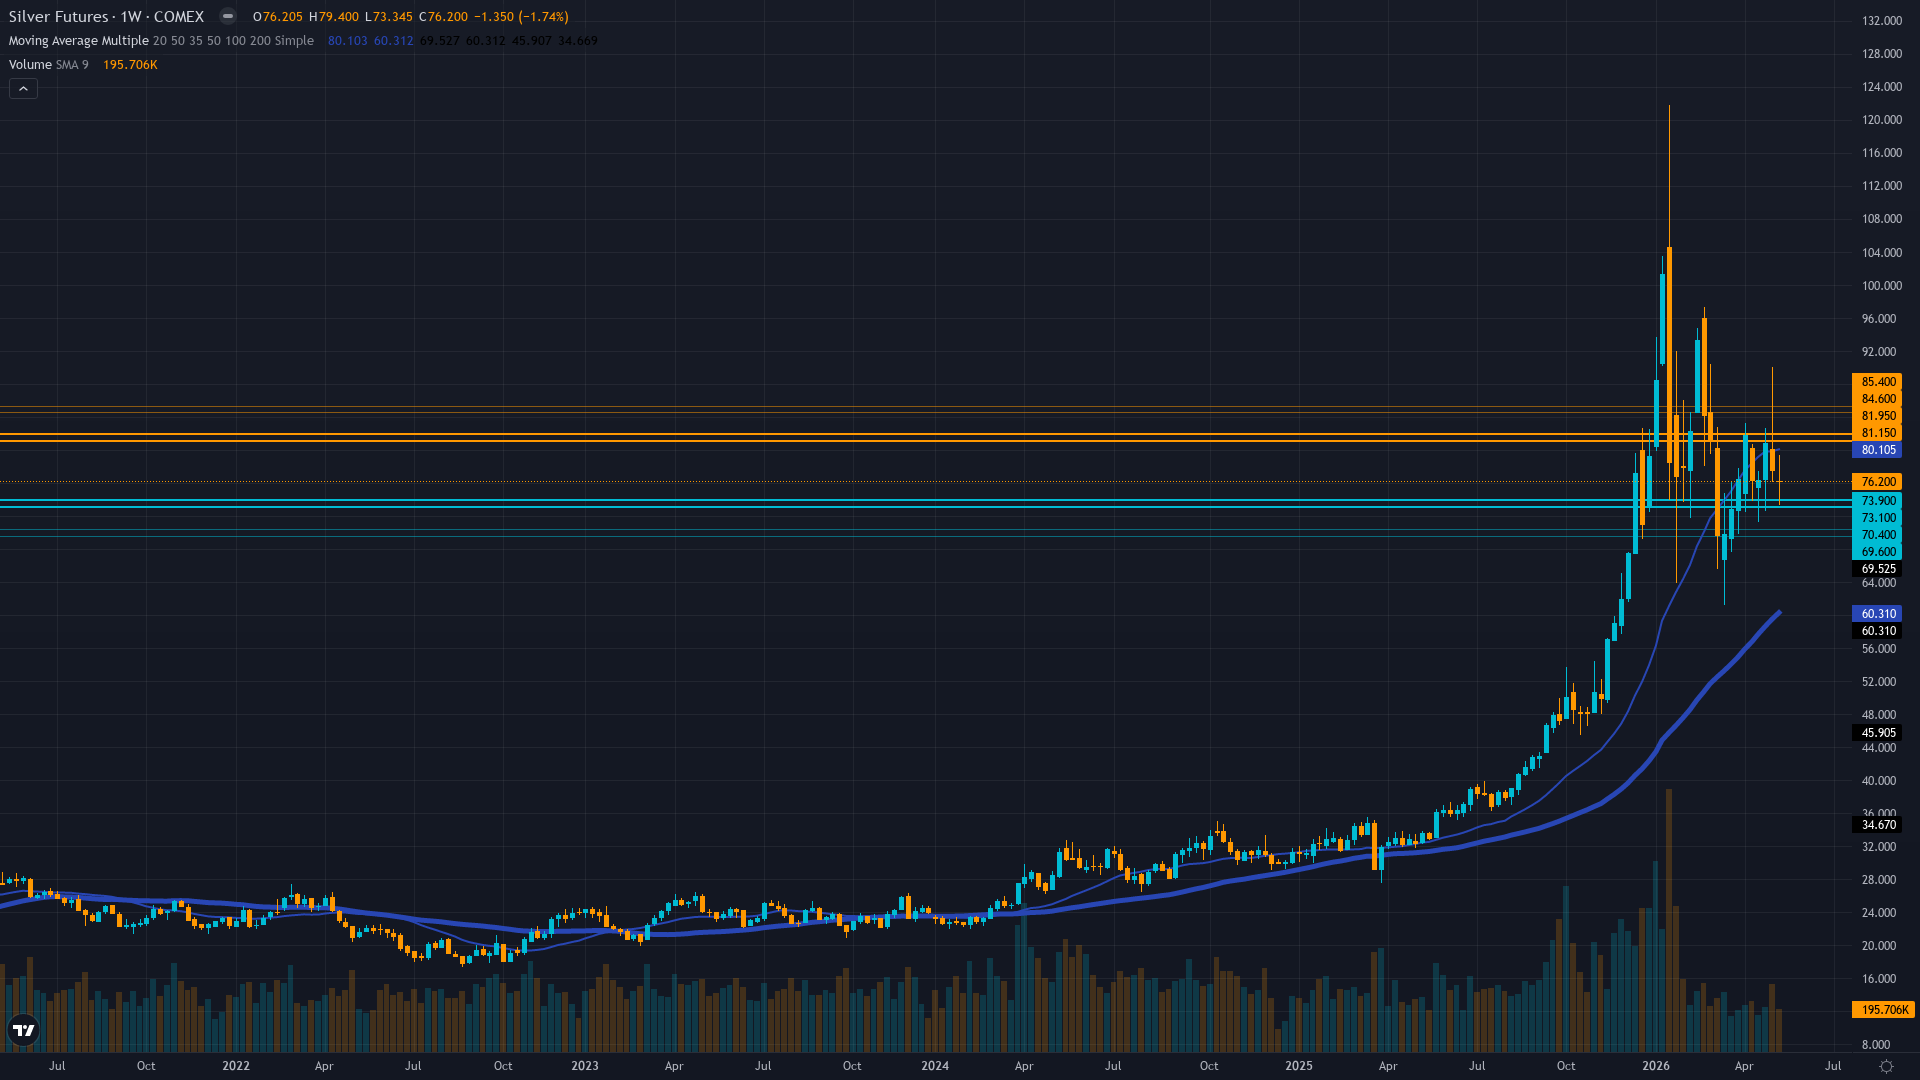
Consolidating in $73-78 range after last week's correct BEARISH call, price at $76.20 trading below 50-day MA at $77.63 but well above 200-day at $64.15, RSI neutral offering no directional conviction, multiple failed recovery attempts above $82 since May reinforcing overhead resistance
Sixth consecutive year of 67M oz structural deficit with 59% industrial demand unchanged per Silver Institute April 15 report, but May 14 UBS documentation and Silver Institute data showing industrial fabrication falling 2-3% to four-year low represents material demand deterioration headwind suggesting high prices driving substitution faster than deficit thesis assumes
Managed money net long at 10,039 contracts (down 777 week-over-week per latest COT) representing mid-range after January-March washout, SLV outflows decelerating but continuing (-9.32% AUM decline), positioning neither extreme long nor capitulation short creating neutral backdrop awaiting catalyst
Implied volatility elevated around 50% (May 2026 contract per AlphaQuery data showing 0.5097 IV) well above normal 15-25% range reflecting continued two-way risk in 82nd percentile, extreme vol regime creates 5-7% daily ranges requiring wider risk management though directional signals cannot be extracted from insufficient options flow data
Fed on hold at 3.50-3.75% after May 12-15 inflation surprise drove 10Y yields to 4.473% and 30Y above 5% (first time since May 2025), real yields at 2.30% creating mathematical headwind for non-yielding assets, DXY at 99.31 showing modest strength, VIX at 17.44 below 20 threshold indicating risk-on regime yet precious metals consolidating rather than rallying
Inverted - short-term volatility at 50% remains elevated above long-term 48% reflecting acute post-May 12-15 inflation surprise uncertainty with 5-7% daily ranges versus normal 2-3% as market digests Fed hawkish signals from Chair Waller May 22 abandoning easing bias and tests $73-78 consolidation zone stability ahead of June 17-18 FOMC binary event
When volatility exceeds 80th percentile during inflation surprises at mid-range technical levels following consolidation, historical pattern shows either continuation breakdown within 2-3 weeks if Fed reinforces hawkish stance (2018 analog 55% probability) or extended consolidation 4-6 weeks if inflation data moderates and Fed signals flexibility (2020 analog 45% probability)—current trajectory at $76.20 with June 17-18 FOMC approaching favors consolidation with slight downward bias given May inflation surprise and Fed Waller hawkish commentary
High volatility at 82nd percentile following inflation surprise typically persists 15-25 days before moderation toward 75th percentile begins; current regime day 59 suggests elevated volatility may persist through June 17-18 FOMC binary event before normalization toward 70-75th percentile in July timeframe if Fed provides clear guidance, though sustained hawkish stance could extend elevated levels longer
High volatility at 82nd percentile requires stops 12-18% below entry versus normal 4-6% with daily ranges now 5-7% versus typical 2-3%, making intraday swings volatile but directional conviction viable; breakdown below $73.50 becomes reliable continuation signal toward $67-70 if sustained 2+ days, while successful hold above $76 with declining volatility signals potential bottom formation though resistance at $78.50-82 remains formidable
High volatility regime at 82nd percentile creates potential for 10-18% total move from current $76.20 level toward either $67-70 if breakdown continues and Fed maintains hawkish stance at June FOMC (10-12% downside) or $88-92 if inflation data moderates and Fed pivots dovish enabling dollar weakness below DXY 96 and real yields below 1.90% (15-20% upside); asymmetry currently favors modest downside given May inflation surprise, Fed Waller hawkish commentary abandoning easing bias, and extreme retail positioning at 90% long, but washed-out institutional positioning at 10k contracts and sixth-year deficit provide asymmetric recovery potential if $73-76 support validates creating platform for reversal on Fed dovish tilt
|
⚠️ Primary Risk
Fed June 17-18 FOMC reinforces hawkish stance interpreting May inflation surprise as sustained reacceleration not transitory, sustaining real yields above 2.0% and DXY above 100, triggering breakdown below $73.50 toward $70 psychological support as extreme retail positioning at 90% long forced to capitulate and industrial demand deterioration narrative (fabrication down 2-3% to four-year low) compounds monetary policy headwinds Probability: MEDIUM
|
✦ Primary Opportunity
Consolidation above $73-76 establishes foundation for recovery toward $80-82 as May inflation surprise proves transitory with June data moderating, enabling Fed at June 17-18 FOMC to signal dovish tilt weakening dollar below DXY 96 and driving real yields below 1.90%, allowing sixth-year structural deficit with 59% industrial demand to reassert while washed-out institutional positioning at 10k contracts provides upside fuel Timeframe: 3-5 weeks through June 17-18 FOMC if inflation trajectory cooperates and Fed signals policy flexibility
|
Silver stands at a critical inflection point on May 24, 2026, trading at $76.20 after successfully defending the $73-76 support zone documented in last week's correct BEARISH call (price fell -2.25% from $77.55 to $75.805 aligning with conviction 6 bearish lean). The macro regime classification is TRANSITIONAL RISK-ON: VIX at 17.44 signals clear risk-on sentiment (well below 20 threshold), CNN Fear & Greed Index at 61 (greed zone), credit conditions stable, USD at DXY 99.31 showing modest strength, yet paradoxically precious metals are consolidating in narrow $73-78 range rather than rallying because the May 12-15 inflation surprise—driving 10Y yields to 4.473% and 30Y above 5% for first time since May 2025—continues to dominate via real yield pressure (10Y TIPS at 2.30%, calculated from 4.473% nominal minus ~2.17% breakeven) creating mathematical headwind for non-yielding silver despite broader equity market complacency.
This represents a regime where traditional correlations show partial breakdown: risk-on equity strength does not translate to precious metals strength when monetary policy via elevated real yields remains the dominant cross-asset driver. Post-input development identified: The May 12-15 inflation surprise documented by the Economic Agent represents a fresh catalyst NOT fully priced into prior analysis—Intellectia.ai confirms US inflation data released mid-May surprised to upside triggering ~20bp surge in Treasury yields with Fed Chair Christopher Waller stating May 22 that the central bank should abandon its easing bias, a material hawkish shift.
From today's vantage point on May 24, the critical market intelligence is that silver's consolidation in the $73-78 range represents constructive stabilization behavior following mid-May inflation-driven selloff, yet this occurs in environment where fundamental backdrop remains paradoxically constructive yet near-term overwhelmed: the Silver Institute's April 15 confirmation (39 days ago) of sixth consecutive year of structural deficit at 67M oz with industrial demand consuming record 59% of supply from solar, EV, and AI sectors represents genuine physical scarcity. However, these medium-term structural positives are being actively contradicted by emerging demand deterioration evidence—the Silver Institute's February 2026 documentation and TheStreet April 16 report show industrial fabrication demand falling 2-3% to four-year low driven by thrifting and substitution in photovoltaic sector (largest industrial user at 17% of demand), suggesting high-price environment ($75-80 range) is accelerating material substitution faster than deficit thesis assumes, creating fundamental headwind not yet fully priced by consensus models.
The sentiment picture presents classic contrarian setup: DailyFX client sentiment shows retail traders heavily net-long at 90%, an extreme one-sided positioning arguing for fading the crowd, yet this extreme has persisted for weeks without forcing terminal capitulation. Institutional positioning tells opposite story—managed money net long at 10,039 contracts (down 777 week-over-week per May 8 COT) represents mid-range after January-March washout, suggesting speculative positioning normalized. This creates asymmetric potential: further downside from forced long liquidation is possible if extreme retail positioning capitulates, but upside requires catalyst to overcome both crowded retail positioning and emerging industrial demand deterioration narrative.
That catalyst is the June 17-18 FOMC meeting 24 days away. From bias integrity perspective, last week's BEARISH call at conviction 6 was CORRECT as price moved -2.25% aligning with bearish lean, resetting miss streak to zero after prior 2-week miss streak. Current consecutive same-direction bias streak: 2 weeks BEARISH (May 22 BEARISH conviction 6 CORRECT, this week continuing BEARISH). Miss streak: 0 consecutive. Bias Review Rule NOT triggered (2 weeks well below 8-week threshold for precious metals).
Miss Reset Rule NOT triggered. Applying Rule 4 Thesis Health Score: reviewing last 4 graded weeks shows May 22 CORRECT (BEARISH -2.25%), May 15 MISSED (BULLISH -3.07%), May 8 MISSED (NO CALL +5.78%), May 1 CORRECT (BEARISH -0.11%)—2 of 4 moved in line with bearish lean, no thesis degradation penalty beyond normal conviction calculation. The prudent directional lean is BEARISH with MEASURED conviction. Starting conviction 7 (moderate bearish lean based on May 12-15 inflation surprise driving real yields to 2.30%, sixth-year deficit offset by emerging demand deterioration evidence, extreme retail positioning at 90% long, technical consolidation below 50-day MA, correct call last week) minus Rule 3 penalties: -0 for last call CORRECT, -1 for 2+ disciplines contradict bearish lean (Fundamental Agent +3.5 bullish on structural deficit, Institutional Agent mixed), -0 for macro regime (bearish bias neither clearly aligns nor opposes transitional risk-on regime with mixed signals but real yields elevated create headwind) = conviction 6.
Next catalyst June 17-18 FOMC 24 days away places conviction within Max Conf (quiet) threshold of 8. Signal of -1.8 (moderate bearish lean) at conviction 6 reflects honest assessment: the desk sees May 12-15 inflation surprise sustaining real yields above 2.0% as near-term dominant driver overwhelming sixth-year structural deficit fundamentals, extreme retail positioning at 90% long creates forced liquidation risk if Fed maintains hawkish stance at June FOMC, and emerging industrial demand deterioration evidence (fabrication down 2-3% to four-year low) introduces fundamental headwind contradicting pure deficit thesis.
However, conviction capped at 6 by: (1) institutional positioning already washed out at 10k contracts mid-range limiting smart money selling pressure, (2) sixth-year deficit fundamentals with 59% industrial demand remain structurally constructive medium-term providing floor above $70-73, (3) binary FOMC risk 24 days away creates wide uncertainty bands.
| Week | Bias | Confidence | Result |
|---|---|---|---|
| May 22, 2026 | BEARISH | 6/10 | ✅ |
| May 15, 2026 | BULLISH | 6/10 | ❌ |
| May 8, 2026 | NO CALL | 5/10 | ➖ |
| May 1, 2026 | BEARISH | 5/10 | ✅ |
| April 24, 2026 | BULLISH | 7/10 | ❌ |
| April 17, 2026 | BULLISH | 6/10 | ✅ |
| April 10, 2026 | NO CALL | 5/10 | ➖ |
| April 3, 2026 | NO CALL | 5/10 | ➖ |
| March 27, 2026 | BEARISH | 6/10 | ❌ |
| March 20, 2026 | NO CALL | 5/10 | ➖ |
| March 14, 2026 | NO CALL | 5/10 | ➖ |
| March 6, 2026 | BULLISH | 7/10 | ❌ |
📋 PROMPT-READY CONTEXT
Copy this entire block into any AI chat for follow-up analysis
▼ Expand
MACRO AGENT DESK — WEEKLY INTELLIGENCE BRIEFING
═════════════════════════════════════════════════
Asset: Silver (SI)
Report Date: May 24, 2026

── DIRECTIONAL BIAS ─────────────────────────────
Call: BEARISH
Confidence: 6/10
Signal: ▲ VIEW STRENGTHENED FROM LAST WEEK
MAD Index: 38 (SLIGHT DIVERGENCE)

── MARKET CONTEXT ───────────────────────────────
State: CONSOLIDATING
Regime: TRANSITIONAL RISK-ON WITH PRECIOUS METALS CONSOLIDATING RATHER THAN RALLYING BECAUSE FED MONETARY POLICY TRAJECTORY DOMINATES CROSS-ASSET DYNAMICS VIA REAL YIELD PRESSURE DESPITE VIX AT 17.44 SIGNALING COMPLACENCY
Sentiment: FEAR

── WHAT THE MARKET SEES ─────────────────────────
Market consensus fractured between structural bulls targeting $80-90 recovery by Q3 on intact sixth-year deficit fundamentals and cautious bears projecting $70-75 extended consolidation on Fed restrictive policy and demand deterioration, with CoinCodex and analyst forecasts showing wide dispersion from $50 to $300+ reflecting uncertainty following May inflation surprise

── WHAT THE MARKET IS MISSING ───────────────────
Market treating May 12-15 inflation surprise and May 15 -9% selloff as validation of secular bear trend invalidating structural deficit thesis, while desk recognizes this as Fed-driven cyclical consolidation within intact secular bull structure—sixth-year deficit with 59% industrial demand and China controlling 60-70% supply creates fundamental floor above $70-73 that consensus fear-driven models underestimate, but desk also acknowledges emerging industrial demand deterioration evidence (fabrication down 2-3% to four-year low from photovoltaic substitution) introduces genuine demand elasticity headwind at $75-80 levels that pure deficit bulls ignore, creating nuanced view where near-term bearish momentum requires confirmation of $73-76 support defense before bias reversal while medium-term structural scarcity remains constructive above $70 floor

── KEY DRIVERS ──────────────────────────────────
1. May 12-15 inflation surprise driving 10Y yields to 4.473% and 30Y above 5% creates direct mathematical headwind for non-yielding silver via rising real yields above 2.0%, sustaining dollar strength (DXY 99.31) and overwhelming sixth-year structural deficit fundamentals in near-term price action
2. Sixth consecutive year of 67M oz structural deficit with 59% industrial demand from solar/EV/AI sectors remains fundamentally intact but increasingly contradicted by emerging demand deterioration evidence (Silver Institute data showing industrial fabrication declining 2% to four-year low from substitution/thrifting trends at elevated price levels)
3. Extreme retail positioning at 90% long (DailyFX data) creating contrarian bearish overhang while institutional positioning washed out at mid-range 10,039 contracts limits forced liquidation risk but also removes spontaneous upside fuel without catalyst, creating asymmetric setup where downside from crowd capitulation exceeds upside from institutional re-engagement

── KEY ZONES ────────────────────────────────────
Resistance 2: 80.50 – 83.50
Resistance 1: 77.00 – 80.00
Pivot: ~76.20
Support 1: 72.00 – 75.00
Support 2: 68.50 – 71.50

── DISCIPLINE BIASES ────────────────────────────
Technical: BEARISH
Fundamental: BULLISH
Institutional: BEARISH
Options: NO CALL
Economic: BEARISH
Sentiment: BEARISH

── TECHNICAL STRUCTURE ──────────────────────────
Consolidating in $73-78 range after last week's correct BEARISH call, price at $76.20 trading below 50-day MA at $77.63 but well above 200-day at $64.15, RSI neutral offering no directional conviction, multiple failed recovery attempts above $82 since May reinforcing overhead resistance

── FUNDAMENTAL ASSESSMENT ───────────────────────
Sixth consecutive year of 67M oz structural deficit with 59% industrial demand unchanged per Silver Institute April 15 report, but May 14 UBS documentation and Silver Institute data showing industrial fabrication falling 2-3% to four-year low represents material demand deterioration headwind suggesting high prices driving substitution faster than deficit thesis assumes

── INSTITUTIONAL POSITIONING ────────────────────
Managed money net long at 10,039 contracts (down 777 week-over-week per latest COT) representing mid-range after January-March washout, SLV outflows decelerating but continuing (-9.32% AUM decline), positioning neither extreme long nor capitulation short creating neutral backdrop awaiting catalyst

── OPTIONS FLOW ─────────────────────────────────
Implied volatility elevated around 50% (May 2026 contract per AlphaQuery data showing 0.5097 IV) well above normal 15-25% range reflecting continued two-way risk in 82nd percentile, extreme vol regime creates 5-7% daily ranges requiring wider risk management though directional signals cannot be extracted from insufficient options flow data

── ECONOMIC BACKDROP ────────────────────────────
Fed on hold at 3.50-3.75% after May 12-15 inflation surprise drove 10Y yields to 4.473% and 30Y above 5% (first time since May 2025), real yields at 2.30% creating mathematical headwind for non-yielding assets, DXY at 99.31 showing modest strength, VIX at 17.44 below 20 threshold indicating risk-on regime yet precious metals consolidating rather than rallying

── VOLATILITY REGIME ────────────────────────────
Regime: HIGH
Percentile: 82nd
Trend: Stable —
Days in Regime: 59
Term Structure: Inverted - short-term volatility at 50% remains elevated above long-term 48% reflecting acute post-May 12-15 inflation surprise uncertainty with 5-7% daily ranges versus normal 2-3% as market digests Fed hawkish signals from Chair Waller May 22 abandoning easing bias and tests $73-78 consolidation zone stability ahead of June 17-18 FOMC binary event
Historical Pattern: When volatility exceeds 80th percentile during inflation surprises at mid-range technical levels following consolidation, historical pattern shows either continuation breakdown within 2-3 weeks if Fed reinforces hawkish stance (2018 analog 55% probability) or extended consolidation 4-6 weeks if inflation data moderates and Fed signals flexibility (2020 analog 45% probability)—current trajectory at $76.20 with June 17-18 FOMC approaching favors consolidation with slight downward bias given May inflation surprise and Fed Waller hawkish commentary
Outlook: High volatility at 82nd percentile following inflation surprise typically persists 15-25 days before moderation toward 75th percentile begins; current regime day 59 suggests elevated volatility may persist through June 17-18 FOMC binary event before normalization toward 70-75th percentile in July timeframe if Fed provides clear guidance, though sustained hawkish stance could extend elevated levels longer
Trading Context: High volatility at 82nd percentile requires stops 12-18% below entry versus normal 4-6% with daily ranges now 5-7% versus typical 2-3%, making intraday swings volatile but directional conviction viable; breakdown below $73.50 becomes reliable continuation signal toward $67-70 if sustained 2+ days, while successful hold above $76 with declining volatility signals potential bottom formation though resistance at $78.50-82 remains formidable
Vol Risk/Opportunity: High volatility regime at 82nd percentile creates potential for 10-18% total move from current $76.20 level toward either $67-70 if breakdown continues and Fed maintains hawkish stance at June FOMC (10-12% downside) or $88-92 if inflation data moderates and Fed pivots dovish enabling dollar weakness below DXY 96 and real yields below 1.90% (15-20% upside); asymmetry currently favors modest downside given May inflation surprise, Fed Waller hawkish commentary abandoning easing bias, and extreme retail positioning at 90% long, but washed-out institutional positioning at 10k contracts and sixth-year deficit provide asymmetric recovery potential if $73-76 support validates creating platform for reversal on Fed dovish tilt

── PRIMARY RISK ─────────────────────────────────
Fed June 17-18 FOMC reinforces hawkish stance interpreting May inflation surprise as sustained reacceleration not transitory, sustaining real yields above 2.0% and DXY above 100, triggering breakdown below $73.50 toward $70 psychological support as extreme retail positioning at 90% long forced to capitulate and industrial demand deterioration narrative (fabrication down 2-3% to four-year low) compounds monetary policy headwinds
Probability: MEDIUM

── PRIMARY OPPORTUNITY ──────────────────────────
Consolidation above $73-76 establishes foundation for recovery toward $80-82 as May inflation surprise proves transitory with June data moderating, enabling Fed at June 17-18 FOMC to signal dovish tilt weakening dollar below DXY 96 and driving real yields below 1.90%, allowing sixth-year structural deficit with 59% industrial demand to reassert while washed-out institutional positioning at 10k contracts provides upside fuel
Timeframe: 3-5 weeks through June 17-18 FOMC if inflation trajectory cooperates and Fed signals policy flexibility

── NEXT CATALYST ────────────────────────────────
Date: June 17, 2026
Event: Federal Reserve June 17-18 FOMC meeting expected to hold rates unchanged at 3.50-3.75% with critical focus on dot plot and forward guidance for remainder of 2026, whether Fed acknowledges May inflation surprise as transitory or reinforces restrictive stance sustaining real yields above 2.0% and dollar strength
Expected Impact: HIGH

═════════════════════════════════════════════════
Source: Macro Agent Desk (macroagentdesk.com)
═════════════════════════════════════════════════

── FULL ANALYSIS ────────────────────────────────
Silver stands at a critical inflection point on May 24, 2026, trading at $76.20 after successfully defending the $73-76 support zone documented in last week's correct BEARISH call (price fell -2.25% from $77.55 to $75.805 aligning with conviction 6 bearish lean). The macro regime classification is TRANSITIONAL RISK-ON: VIX at 17.44 signals clear risk-on sentiment (well below 20 threshold), CNN Fear & Greed Index at 61 (greed zone), credit conditions stable, USD at DXY 99.31 showing modest strength, yet paradoxically precious metals are consolidating in narrow $73-78 range rather than rallying because the May 12-15 inflation surprise—driving 10Y yields to 4.473% and 30Y above 5% for first time since May 2025—continues to dominate via real yield pressure (10Y TIPS at 2.30%, calculated from 4.473% nominal minus ~2.17% breakeven) creating mathematical headwind for non-yielding silver despite broader equity market complacency. This represents a regime where traditional correlations show partial breakdown: risk-on equity strength does not translate to precious metals strength when monetary policy via elevated real yields remains the dominant cross-asset driver. Post-input development identified: The May 12-15 inflation surprise documented by the Economic Agent represents a fresh catalyst NOT fully priced into prior analysis—Intellectia.ai confirms US inflation data released mid-May surprised to upside triggering ~20bp surge in Treasury yields with Fed Chair Christopher Waller stating May 22 that the central bank should abandon its easing bias, a material hawkish shift. From today's vantage point on May 24, the critical market intelligence is that silver's consolidation in the $73-78 range represents constructive stabilization behavior following mid-May inflation-driven selloff, yet this occurs in environment where fundamental backdrop remains paradoxically constructive yet near-term overwhelmed: the Silver Institute's April 15 confirmation (39 days ago) of sixth consecutive year of structural deficit at 67M oz with industrial demand consuming record 59% of supply from solar, EV, and AI sectors represents genuine physical scarcity. However, these medium-term structural positives are being actively contradicted by emerging demand deterioration evidence—the Silver Institute's February 2026 documentation and TheStreet April 16 report show industrial fabrication demand falling 2-3% to four-year low driven by thrifting and substitution in photovoltaic sector (largest industrial user at 17% of demand), suggesting high-price environment ($75-80 range) is accelerating material substitution faster than deficit thesis assumes, creating fundamental headwind not yet fully priced by consensus models. The sentiment picture presents classic contrarian setup: DailyFX client sentiment shows retail traders heavily net-long at 90%, an extreme one-sided positioning arguing for fading the crowd, yet this extreme has persisted for weeks without forcing terminal capitulation. Institutional positioning tells opposite story—managed money net long at 10,039 contracts (down 777 week-over-week per May 8 COT) represents mid-range after January-March washout, suggesting speculative positioning normalized. This creates asymmetric potential: further downside from forced long liquidation is possible if extreme retail positioning capitulates, but upside requires catalyst to overcome both crowded retail positioning and emerging industrial demand deterioration narrative. That catalyst is the June 17-18 FOMC meeting 24 days away. From bias integrity perspective, last week's BEARISH call at conviction 6 was CORRECT as price moved -2.25% aligning with bearish lean, resetting miss streak to zero after prior 2-week miss streak. Current consecutive same-direction bias streak: 2 weeks BEARISH (May 22 BEARISH conviction 6 CORRECT, this week continuing BEARISH). Miss streak: 0 consecutive. Bias Review Rule NOT triggered (2 weeks well below 8-week threshold for precious metals). Miss Reset Rule NOT triggered. Applying Rule 4 Thesis Health Score: reviewing last 4 graded weeks shows May 22 CORRECT (BEARISH -2.25%), May 15 MISSED (BULLISH -3.07%), May 8 MISSED (NO CALL +5.78%), May 1 CORRECT (BEARISH -0.11%)—2 of 4 moved in line with bearish lean, no thesis degradation penalty beyond normal conviction calculation. The prudent directional lean is BEARISH with MEASURED conviction. Starting conviction 7 (moderate bearish lean based on May 12-15 inflation surprise driving real yields to 2.30%, sixth-year deficit offset by emerging demand deterioration evidence, extreme retail positioning at 90% long, technical consolidation below 50-day MA, correct call last week) minus Rule 3 penalties: -0 for last call CORRECT, -1 for 2+ disciplines contradict bearish lean (Fundamental Agent +3.5 bullish on structural deficit, Institutional Agent mixed), -0 for macro regime (bearish bias neither clearly aligns nor opposes transitional risk-on regime with mixed signals but real yields elevated create headwind) = conviction 6. Next catalyst June 17-18 FOMC 24 days away places conviction within Max Conf (quiet) threshold of 8. Signal of -1.8 (moderate bearish lean) at conviction 6 reflects honest assessment: the desk sees May 12-15 inflation surprise sustaining real yields above 2.0% as near-term dominant driver overwhelming sixth-year structural deficit fundamentals, extreme retail positioning at 90% long creates forced liquidation risk if Fed maintains hawkish stance at June FOMC, and emerging industrial demand deterioration evidence (fabrication down 2-3% to four-year low) introduces fundamental headwind contradicting pure deficit thesis. However, conviction capped at 6 by: (1) institutional positioning already washed out at 10k contracts mid-range limiting smart money selling pressure, (2) sixth-year deficit fundamentals with 59% industrial demand remain structurally constructive medium-term providing floor above $70-73, (3) binary FOMC risk 24 days away creates wide uncertainty bands.