Crude Oil COT & Institutional Positioning — Smart Money Analysis
Crude Oil institutional positioning: COT data, sentiment analysis and smart money flow assessment.

Institutional Positioning
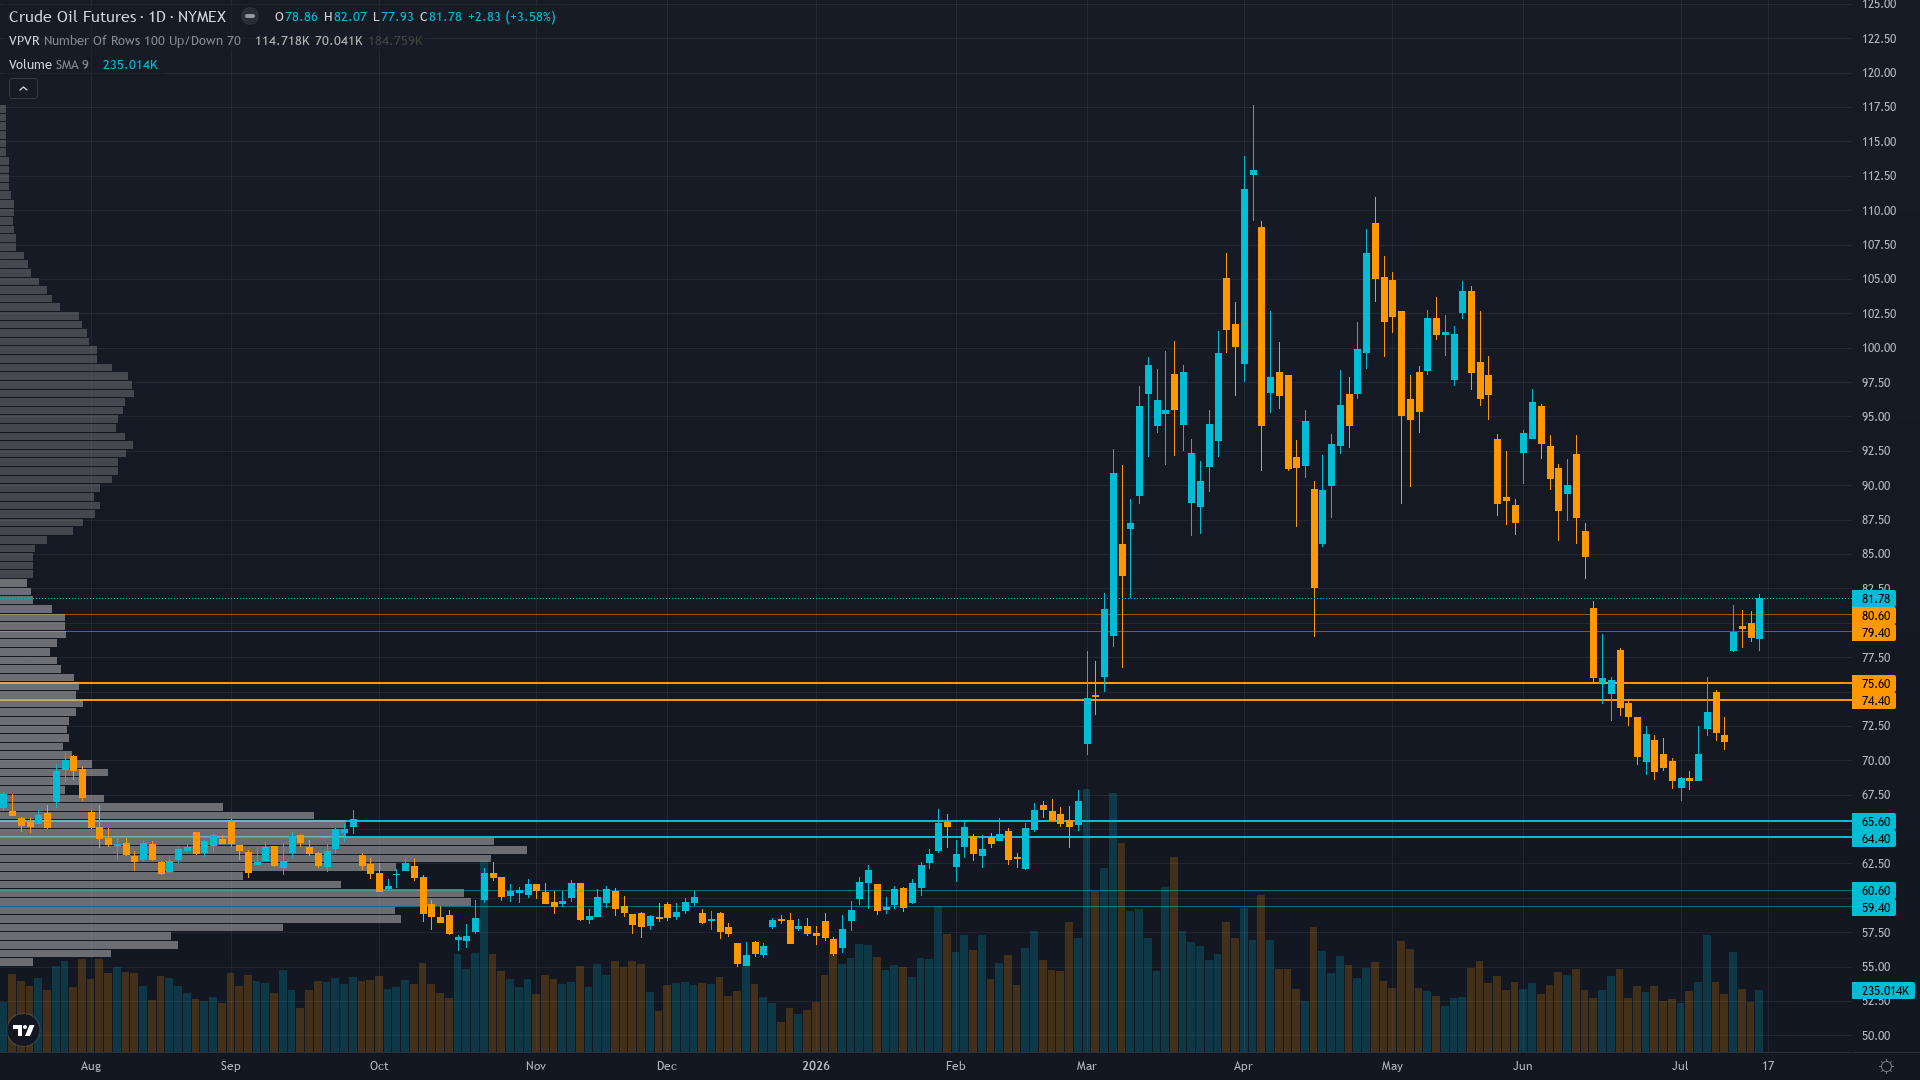
crude oil sits at 71.41 after slipping 0.93% — a shallow pullback rather than a decisive move.
COT data stale (June 30, 12 days old) showing managed money net long 135k contracts but positioning complicated by unprecedented physical-paper divergence from 2026 Hormuz crisis; U.S.-Iran MOU June 18 represents policy-level normalization commitment creating asymmetric positioning unwind risk
Crowd Psychology
Neither side has committed heavily to crude oil futures, leaving sentiment in a neutral zone that offers little directional guidance on its own.
Options Flow
Insufficient current data quality for directional signal; OVX crude volatility likely moderating from crisis extremes as geopolitical fear premium compresses post-MOU signing June 18, though elevated absolute levels indicate ongoing normalization execution uncertainty
Market Consensus vs Our Analysis
Market consensus: Tactically uncertain with market having completed mean reversion as current $71.41 WTI at pre-war February levels MINUS $2 per IEA July 10 report; structural oversupply consensus (IEA 4.7 mb/d surplus, EIA -1.2 mb/d demand decline) validates bearish fundamental picture yet current pricing suggests full discounting with minimal remaining edge as U.S.-Iran MOU June 18 removes last geopolitical catalyst
Primary driver: Geopolitical premium complete exhaustion as WTI collapsed 40% from March $120 peak to current $71.41 following Strait of Hormuz normalization (U.S.-Iran MOU signed June 18), while IEA July 2026 report confirms global oil demand declining 1.0 mb/d in 2026 creating structural oversupply as OPEC+ announces 188k bpd August production increase into weakening market
Putting It Together
In summary, the positioning picture for crude oil reflects fear transitioning to exhaustion conviction levels set against a breaking down market backdrop. Trend strength registers just 2/10, which typically corresponds to choppy, directionless price action. The interplay between smart money activity, retail sentiment, and options market signals will shape how this positioning resolves.
This analysis covers one dimension. Our full weekly report combines six specialist agents into a single actionable briefing with directional bias, key levels, and risk-opportunity matrix.
Start Free — Get the Market of the WeekFree weekly report · No credit card · Upgrade anytime



