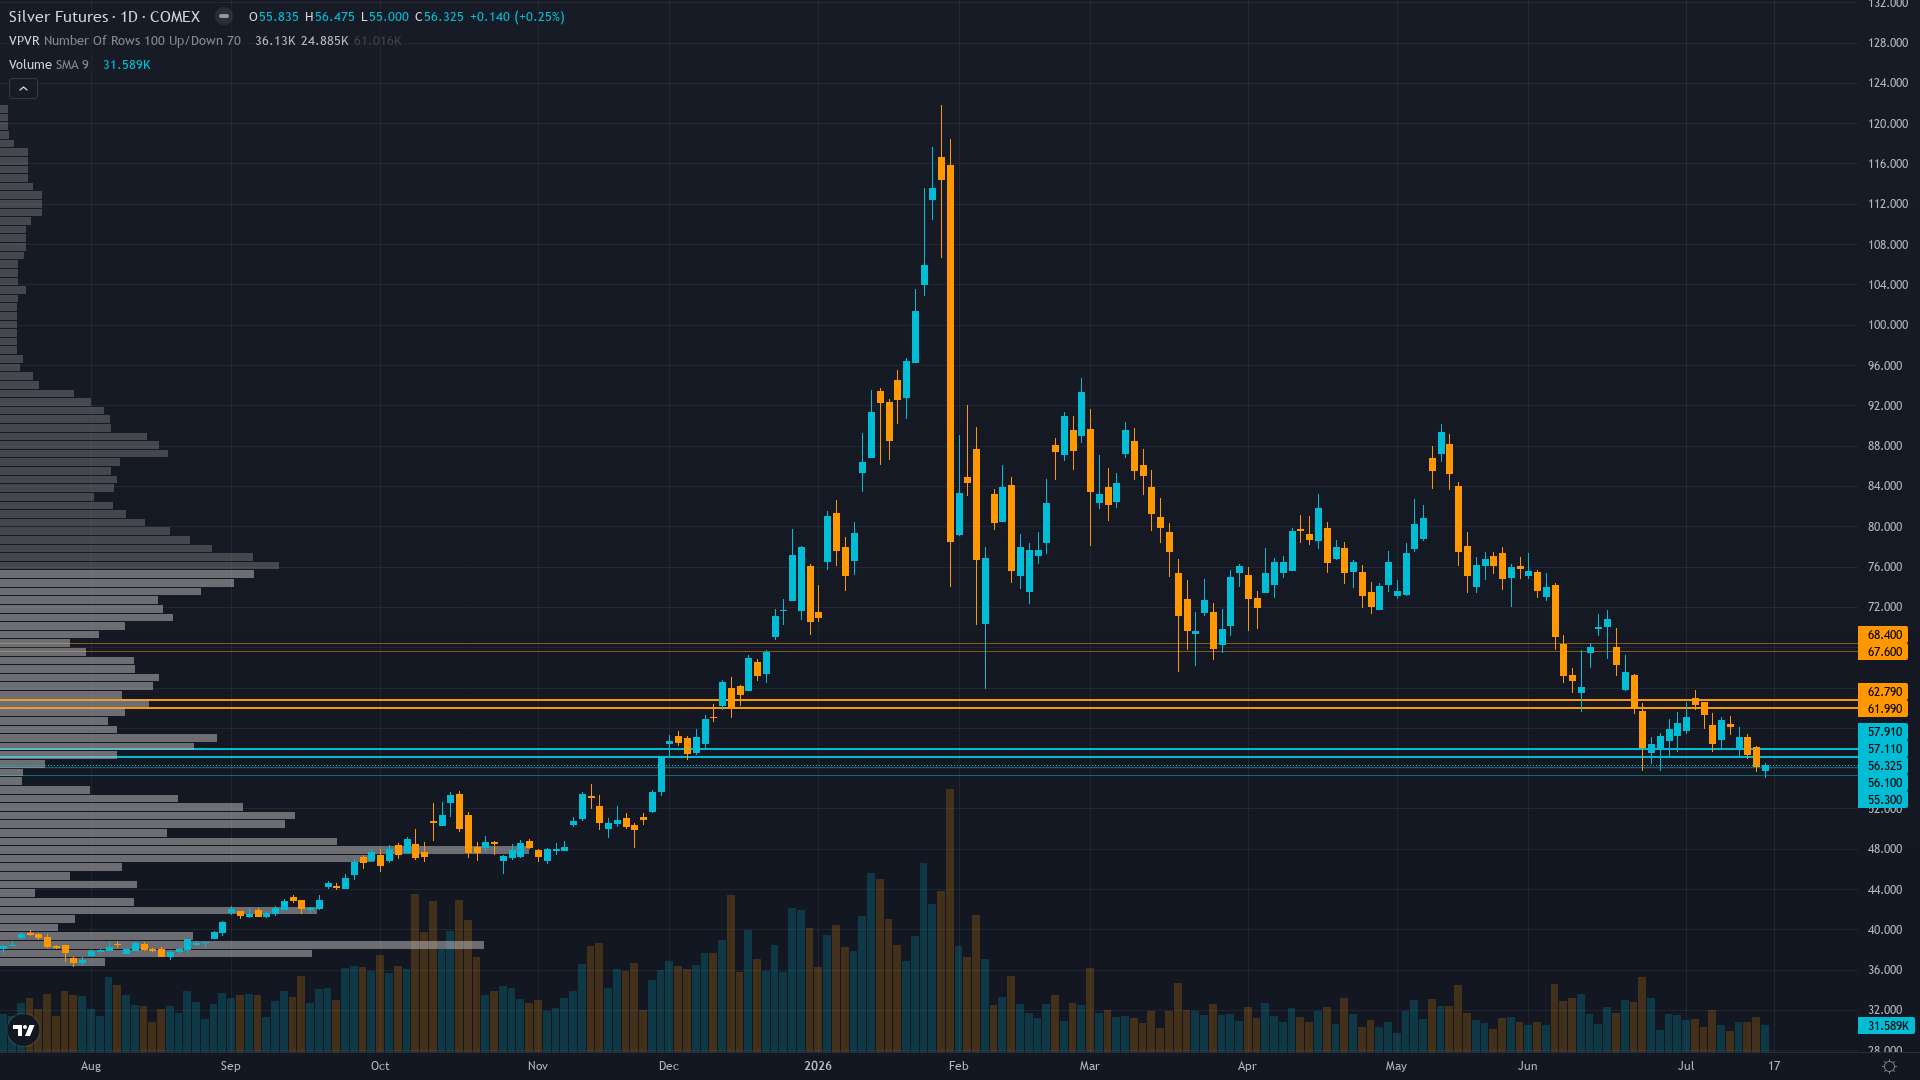
RISK-ON TRANSITIONAL WITH PRECIOUS METALS BREAKING DOWN RATHER THAN RALLYING BECAUSE JUNE 14 CPI DOVISH SURPRISE (HEADLINE -0.4% LARGEST MONTHLY DECLINE SINCE APRIL 2020 PER GOLDSILVER.COM) PROVIDED ONLY TEMPORARY RELIEF FROM FED HAWKISH TRAJECTORY ESTABLISHED AT JUNE 16-17 FOMC WHERE 9-OF-18 MEMBERS PROJECTED POTENTIAL 2026 RATE HIKES, SUSTAINING REAL YIELDS ABOVE 2.17% AND DXY NEAR 13-MONTH HIGHS CREATING MATHEMATICAL HEADWIND FOR NON-YIELDING SILVER THAT OVERRIDES LOW VIX 15.67 COMPLACENCY AND CNN FEAR & GREED 37 (FEAR) REGIME WHERE MONETARY POLICY TRAJECTORY VIA ELEVATED REAL YIELDS DOMINATES CROSS-ASSET CORRELATIONS
The Institutional Landscape
Trading at 56.38 after a 3.00% slide, silver faces sustained selling interest.
Managed money post-liquidation at mid-range after January-June washout per July 14 COT with institutional selling pressure normalized, SLV ETF outflows continuing at -9.32% AUM decline (down 17.35% past month per July 15 data) confirming institutional de-risking but positioning neither extreme long nor capitulation short creating neutral backdrop where further downside from smart money limited yet retail capitulation remains possible if $55.41 support fails
Market Sentiment
The sentiment picture for silver futures is evenly split, providing no contrarian signal in either direction. The next move will likely be event-driven.
What Options Markets Show
Implied volatility elevated at 58.52% for July 2026 expiration well above normal 20-40% range reflecting continued two-way risk per Options Agent July 19, extreme volatility regime persisting creates 5-7% daily ranges requiring disciplined risk management, insufficient directional flow data prevents strong signal extraction though elevated IV confirms binary FOMC uncertainty 9 days ahead
Consensus vs MAD View
Market consensus: Market consensus fractured between structural deficit bulls targeting $68-79 recovery on intact sixth-year deficit fundamentals and gold-silver ratio at 69.2:1 peak arguing 20-42% undervaluation versus consensus $79.57/oz, versus cautious bears with CoinCodex algorithm predicting -8.81% decline to $50.67 by July 23 suggesting continued algorithmic bearish lean, wide dispersion reflecting July 29 FOMC binary uncertainty
Primary driver: June 14 CPI dovish surprise (-0.4% MoM headline, 0.0% core) delivered temporary relief by reducing July 28-29 FOMC rate hike probability from 42% to 17%, but last week's continuation breakdown from $60.17 to $56.38 (-6.3%) validates ninth consecutive BEARISH week as sustained dollar strength (DXY near 13-month highs) and real yields above 2.17% continue to overwhelm sixth-year structural deficit fundamentals
The Bottom Line on Positioning
The positioning mosaic for SI futures combines fear sentiment with stable from peak volatility conditions. Trend strength is low at 2/10, indicating weak directional conviction and potential for range-bound behaviour. Taken together, institutional behaviour, crowd psychology, and derivatives data frame the setup heading into the new week.
Consensus vs Reality
Last Week's Consensus
“Market consensus fractured between structural deficit bulls targeting $68-75 recovery on intact sixth-year deficit fundamentals per Silver Institute July 6 update and cautious bears projecting $55-58 test if July 14 CPI hot, with CoinCodex algorithm predicting -4.31% to $57.26 by July 17 suggesting bearish algorithmic lean while Barchart expects continued volatility throughout remainder 2026”
▼
What Actually Happened
-6.30%
60.17 → 56.38
Quick Answers
What is the current outlook for Silver?
Market consensus fractured between structural deficit bulls targeting $68-79 recovery on intact sixth-year deficit fundamentals and gold-silver ratio at 69.2:1 peak arguing 20-42% undervaluation versus consensus $79.57/oz, versus cautious bears with CoinCodex algorithm predicting -8.81% decline to $50.67 by July 23 suggesting continued algorithmic bearish lean, wide dispersion reflecting July 29 FOMC binary uncertainty
What are the key factors influencing Silver right now?
June 14 CPI dovish surprise (-0.4% MoM headline, 0.0% core) delivered temporary relief by reducing July 28-29 FOMC rate hike probability from 42% to 17%, but last week's continuation breakdown from $60.17 to $56.38 (-6.3%) validates ninth consecutive BEARISH week as sustained dollar strength (DXY near 13-month highs) and real yields above 2.17% continue to overwhelm sixth-year structural deficit fundamentals
Is Silver volatility high or low right now?
The volatility profile for Silver shows a high regime at the 83th 90-day percentile. The vol trend is stable from peak, with short-term (52%), medium-term (54%), and longer-term (50%) readings reflecting the current environment.
What seasonal patterns affect Silver?
Seasonal analysis for Silver in July 2026 indicates a neutral lean, backed by a 50% historical win rate. .
What is the smart money doing in Silver?
Managed money post-liquidation at mid-range after January-June washout per July 14 COT with institutional selling pressure normalized, SLV ETF outflows continuing at -9.32% AUM decline (down 17.35% past month per July 15 data) confirming institutional de-risking but positioning neither extreme long nor capitulation short creating neutral backdrop where further downside from smart money limited yet retail capitulation remains possible if $55.41 support fails
This analysis covers one dimension. Our full weekly report combines six specialist agents into a single actionable briefing with directional bias, key levels, and risk-opportunity matrix.