Copper Forecast This Week — Outlook, Drivers & Key Levels
This week's Copper outlook: key drivers, volatility context, risk-opportunity assessment and the week ahead.

Current Market Picture
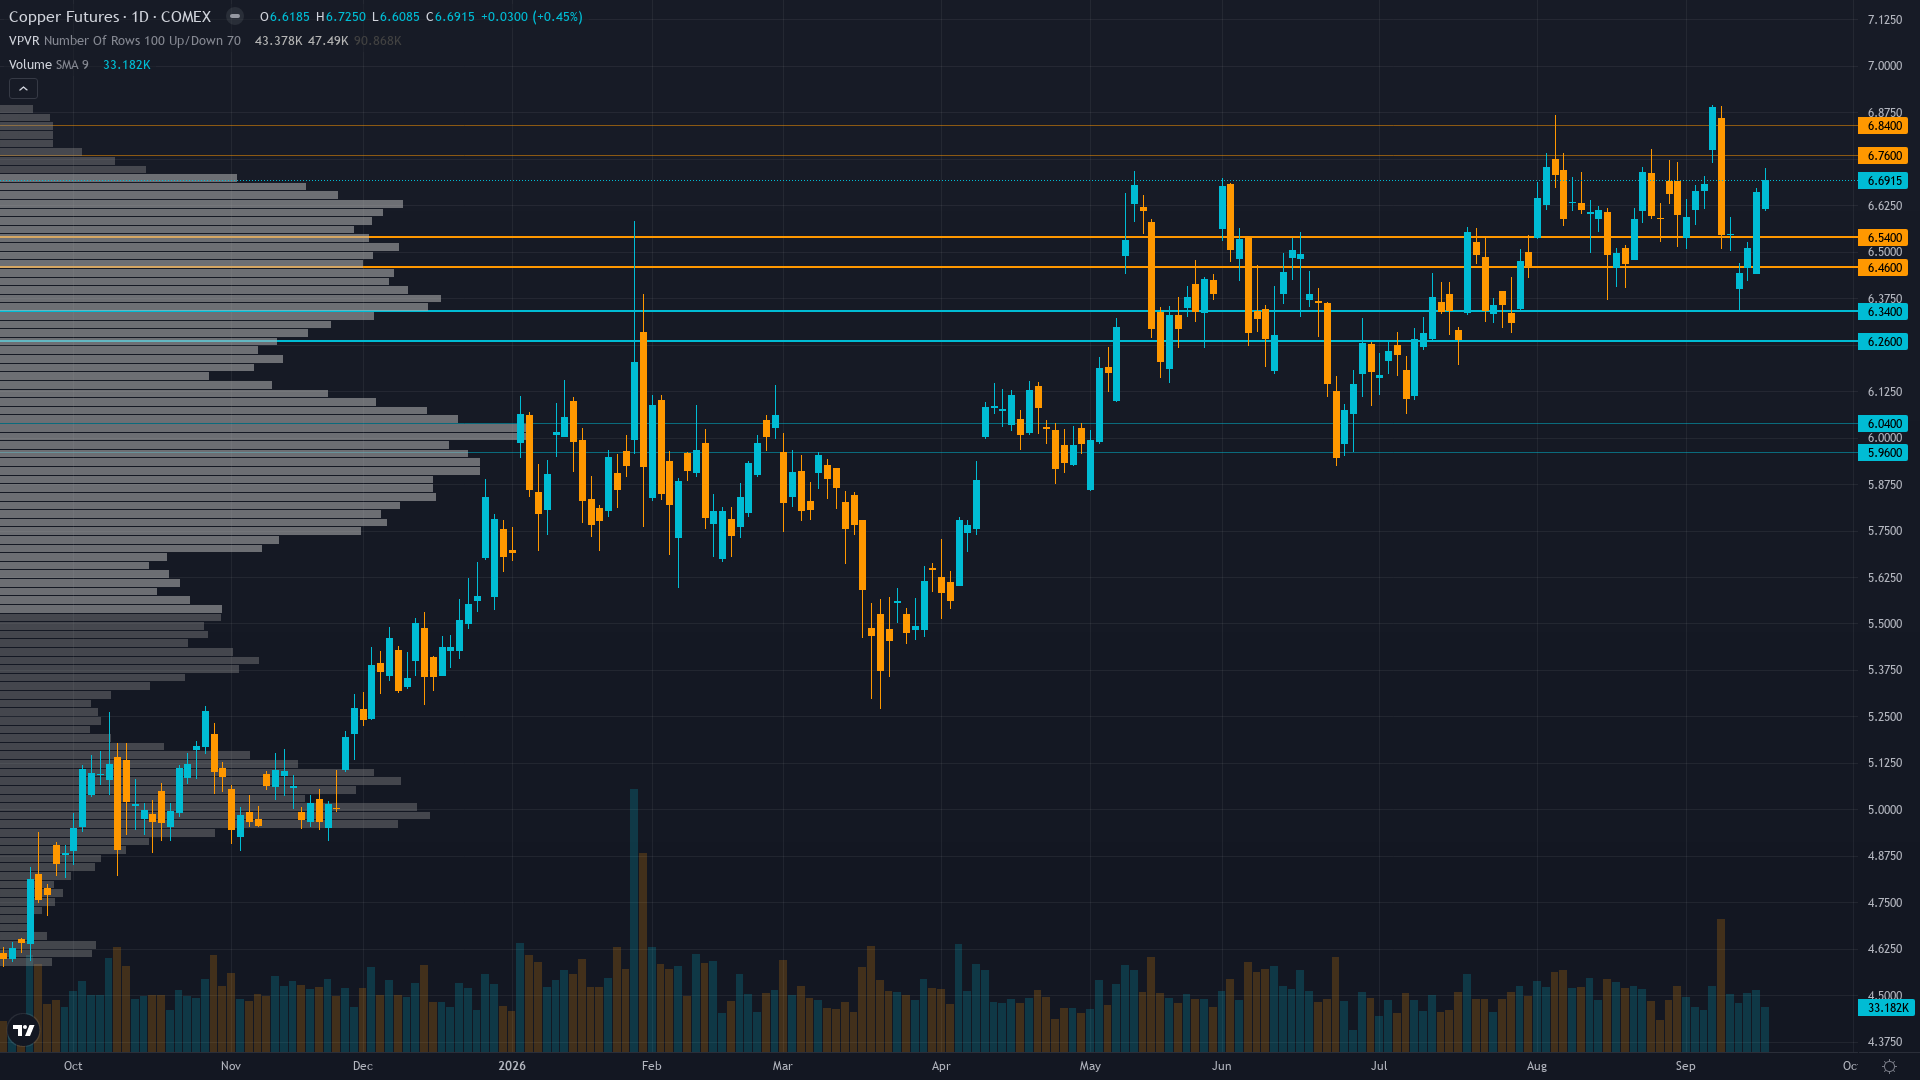
copper holds at 6.615, up a marginal 0.43% as the market grinds forward. Directional momentum continues to define copper futures, with the trend firmly in control of price action.
Copper trading near all-time nominal highs supported by structural supply deficit and El Niño production disruptions, but consolidating after the Fed's 25bp rate hike and tariff uncertainty with COT de-risking from extreme levels and LME stocks rising modestly
Key Drivers This Week
Primary driver: Structural supply deficit confirmed by El Niño-driven simultaneous production disruptions across South America (flooding in Chile/Peru mines) and Africa (drought reducing hydroelectric power) in September 2026, with ING forecasting 600,000-tonne deficit for 2026 and Codelco withdrawing its production target on Aug 13
Secondary factor: LME copper hit all-time nominal record of $14,533/tonne on Sep 7, 2026 driven by tariff anticipation and supply scarcity, with price consolidating near $6.62/lb ($14,600/tonne) as market digests the Sep 16-17 Fed 25bp rate hike to ~3.88% while maintaining structural bid from physical tightness
Additional influence: COT non-commercial net long at 75,134 contracts (93rd percentile, 26% of OI) declined -17,342 contracts WoW from the 99.4th percentile all-time high, representing healthy speculative de-risking that reduces mean-reversion risk while still maintaining strong bullish conviction in a structurally deficit market
Economic backdrop: TRANSITIONAL macro regime after Sep 16-17 Fed 25bp hike to ~3.88%, VIX at 14.81 (low risk), US 10Y at 5.01% (+5bp on week), China LPR holds at 3.0/3.5% today, US unemployment at 4.1%, inflation at 2.33%, industrial production stabilizing at 103.07
Fundamental assessment: Structural deficit of 600,000 tonnes for 2026 per ING, copper appears 8-10% undervalued vs fair value on supply deficit/AI infrastructure/energy transition demand, El Niño disruptions intensifying Sept 2026 across South America and Africa simultaneously representing fresh catalyst exacerbating structural deficit
Price Structure
Price at $6.615 trading well above 50-day and 200-day moving averages at 91.6% of 52-week range, immediate resistance at $6.70 psychological level and $6.8035 52-week high, support at $6.50 (consolidation level) and $6.20 (prior breakout level), RSI at 45.5 suggesting mean-reversion potential but no bearish exhaustion
Trend strength sits at 7/10, reflecting a market that has directional bias but hasn't reached extreme conviction.
Upside & Downside
Primary risk: Post-Fed rate hike dollar strengthening to 5.01% 10Y yield creates headwind for dollar-denominated commodities, combined with COT still at 93rd percentile extreme and LME stocks rising to 255,900t with contango structure signalling easing physical tightness — if these coincide with China demand disappointment at Sep 24-25 jobless claims/durable goods data, could trigger speculative long unwind toward $6.20 support (Probability: medium)
Primary opportunity: El Niño dual-region production disruptions (flooding Americas, drought Africa) represent FRESH supply shock catalyst that post-dates the CFTC COT reporting period and the LME stock build, providing fundamental justification for renewed upside toward $6.8035 52-week high and beyond as structural deficit premium reasserts over near-term inventory noise (Timeframe: 1-3 weeks as El Niño disruption impacts materialize through Cochilco production reports and LME inventory data through late September, with seasonal tailwind from Sep-Oct downstream demand recovery per 15-year seasonal pattern)
This week's edge: The market may be overweighting the LME stock build to 255,900t and the shift from backwardation to contango as evidence of easing physical tightness, while underweighting that the FRESH September 2026 El Niño dual-region production disruptions (flooding in Chilean/Peruvian mines from excess rainfall, drought in African copper regions reducing hydroelectric power) represent a simultaneous supply shock to both hemispheres that post-dates the reported inventory data — this is a genuine physical disruption catalyst that justifies elevated pricing and supports continuation toward $6.8035 52-week high
Volatility Context
At the 48th percentile, copper price volatility sits in a normal range, neither compressed enough to signal a breakout nor elevated enough to demand caution. Realised vol is holding its current level, suggesting the market has found a temporary equilibrium in its risk pricing.
Current 26.5% realised vol suggests daily ranges of 1.5-2.0% below the 2.69% average weekly move for HG, reflecting measured consolidation near record highs; the Sep 21 China LPR catalyst and Sep 24-25 US data window provide potential triggers for 4-6% directional expansion from current $6.615 pivot, with $6.50 immediate support and $6.70 resistance defining the near-term trading envelope
Seasonal Patterns
Seasonality is a non-factor for COMEX copper this month, with a 48% historical win rate offering no edge. Restocking ahead of Q4 production.
Looking Forward
All eyes turn to China Loan Prime Rate decisions (1Y and 5Y) — 1Y expected at 3.0%, 5Y at 3.5% — critical demand signal for world's 50% copper consumer, with no change expected but any cut would be significantly bullish for industrial metals on Monday 21 September, which carries enough weight to force a decisive directional move.
The week ahead for copper price hinges on whether the prevailing trending regime can absorb the scheduled catalysts without a regime shift.
This analysis covers one dimension. Our full weekly report combines six specialist agents into a single actionable briefing with directional bias, key levels, and risk-opportunity matrix.
Start Free — Get the Market of the WeekFree weekly report · No credit card · Upgrade anytime