30-Year Treasury COT & Institutional Positioning — Smart Money Analysis
30-Year Treasury institutional positioning: COT data, sentiment analysis and smart money flow assessment.

The Institutional Landscape
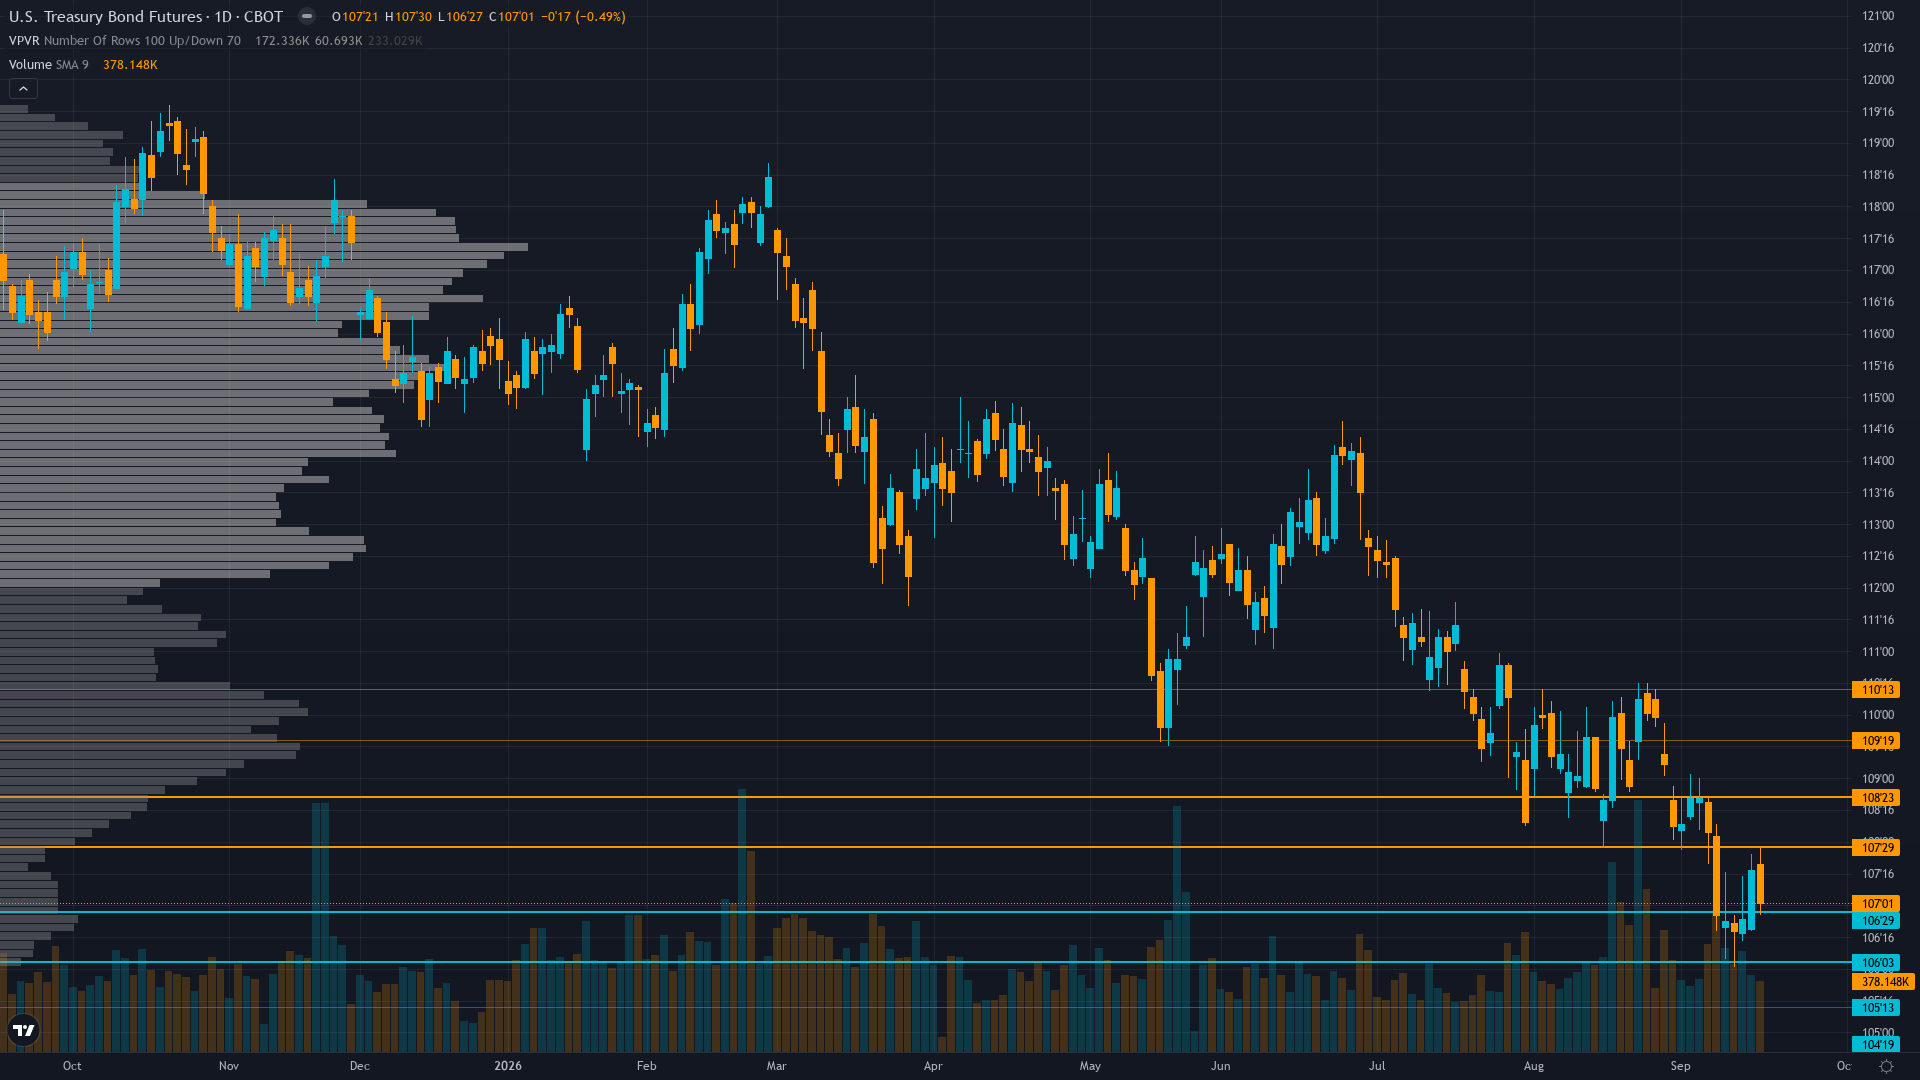
30-year Treasury holds at 107.5625, off 0.17% in a modest retracement from recent levels.
CFTC COT Sep 15: non-commercial net short -203,157 contracts (-10.9% of OI, 3.2nd percentile of 3-year range, near the 3-year minimum of -239,646) with speculators virtually flat week-over-week (-2,640 change) — extreme bearish positioning that has persisted near record levels for 6+ consecutive weeks without covering; commercial net long +141,163 providing structural bid; hedge fund basis trade exposure remains elevated creating vulnerability to forced deleveraging on vol spikes, though the actual Fed hike has validated rather than punished short positioning
Market Consensus vs Our Analysis
Market consensus: Market pricing structural bearish duration environment with 30Y at 5.34% (19-year highs); ZB at 107.56 near 52-week low after Fed 25bp hike on Sep 16 validated hawkish repricing cycle; Bessent buyback acknowledged as partial offset but insufficient to absorb $1.97T fiscal deficit supply; market expecting Fed on hold after September hike with dot plot showing low 4% through 2027
Primary driver: Fed 25bp hike on Sep 16 to 3.75-4.00% (first hike since 2023, 12-0 vote) with dot plot projecting low 4% fed funds through 2027 — the hawkish repricing cycle that began with Warsh's June 17 removal of easing bias has culminated in actual policy tightening, validating the structural bearish thesis for long duration as 30Y yields hold at 5.34% and ZB trades at the 3.1st percentile of its 52-week range
Contrarian Assessment
Low-to-mild divergence: desk's BEARISH bias aligns with consensus bearish market positioning (COT 3.2nd percentile, yields at 19-year highs) and the actual Fed hike on Sep 16 validates the structural thesis, but the desk identifies that the extreme short crowding (6+ weeks without covering near the 3-year minimum) and the modest -0.32% post-hike selloff suggest the market may be fully priced for bearishness while the desk sees asymmetric squeeze risk the consensus is not actively pricing — though the alignment of directional bias keeps the overall divergence score moderate at 25
Sentiment & Positioning
Sentiment around Treasury bond futures is neutral, with no extreme positioning on either side. This balanced state often resolves when a catalyst breaks the equilibrium.
Options Market Signal
ZB options implied volatility around 10.03% (Barchart Sep 20) with MOVE Index showing elevated bond volatility regime; post-FOMC the MOVE likely stabilized from its Sep 13 spike to 82.21 as the binary catalyst resolved; limited ZB-specific put/call data available but the resolution of the Sep 16 FOMC has reduced near-term tail risk premium relative to pre-FOMC levels, though elevated yield volatility persists with 30Y above 5.30%
Putting It Together
In summary, the positioning picture for 30-year Treasury reflects fear conviction levels set against a breaking down market backdrop. Trend strength sits at 7/10, reflecting a market that has directional bias but hasn't reached extreme conviction. The interplay between smart money activity, retail sentiment, and options market signals will shape how this positioning resolves.
This analysis covers one dimension. Our full weekly report combines six specialist agents into a single actionable briefing with directional bias, key levels, and risk-opportunity matrix.
Start Free — Get the Market of the WeekFree weekly report · No credit card · Upgrade anytime