Copper Forecast This Week — Outlook, Drivers & Key Levels
This week's Copper outlook: key drivers, volatility context, risk-opportunity assessment and the week ahead.

This Week's Starting Point
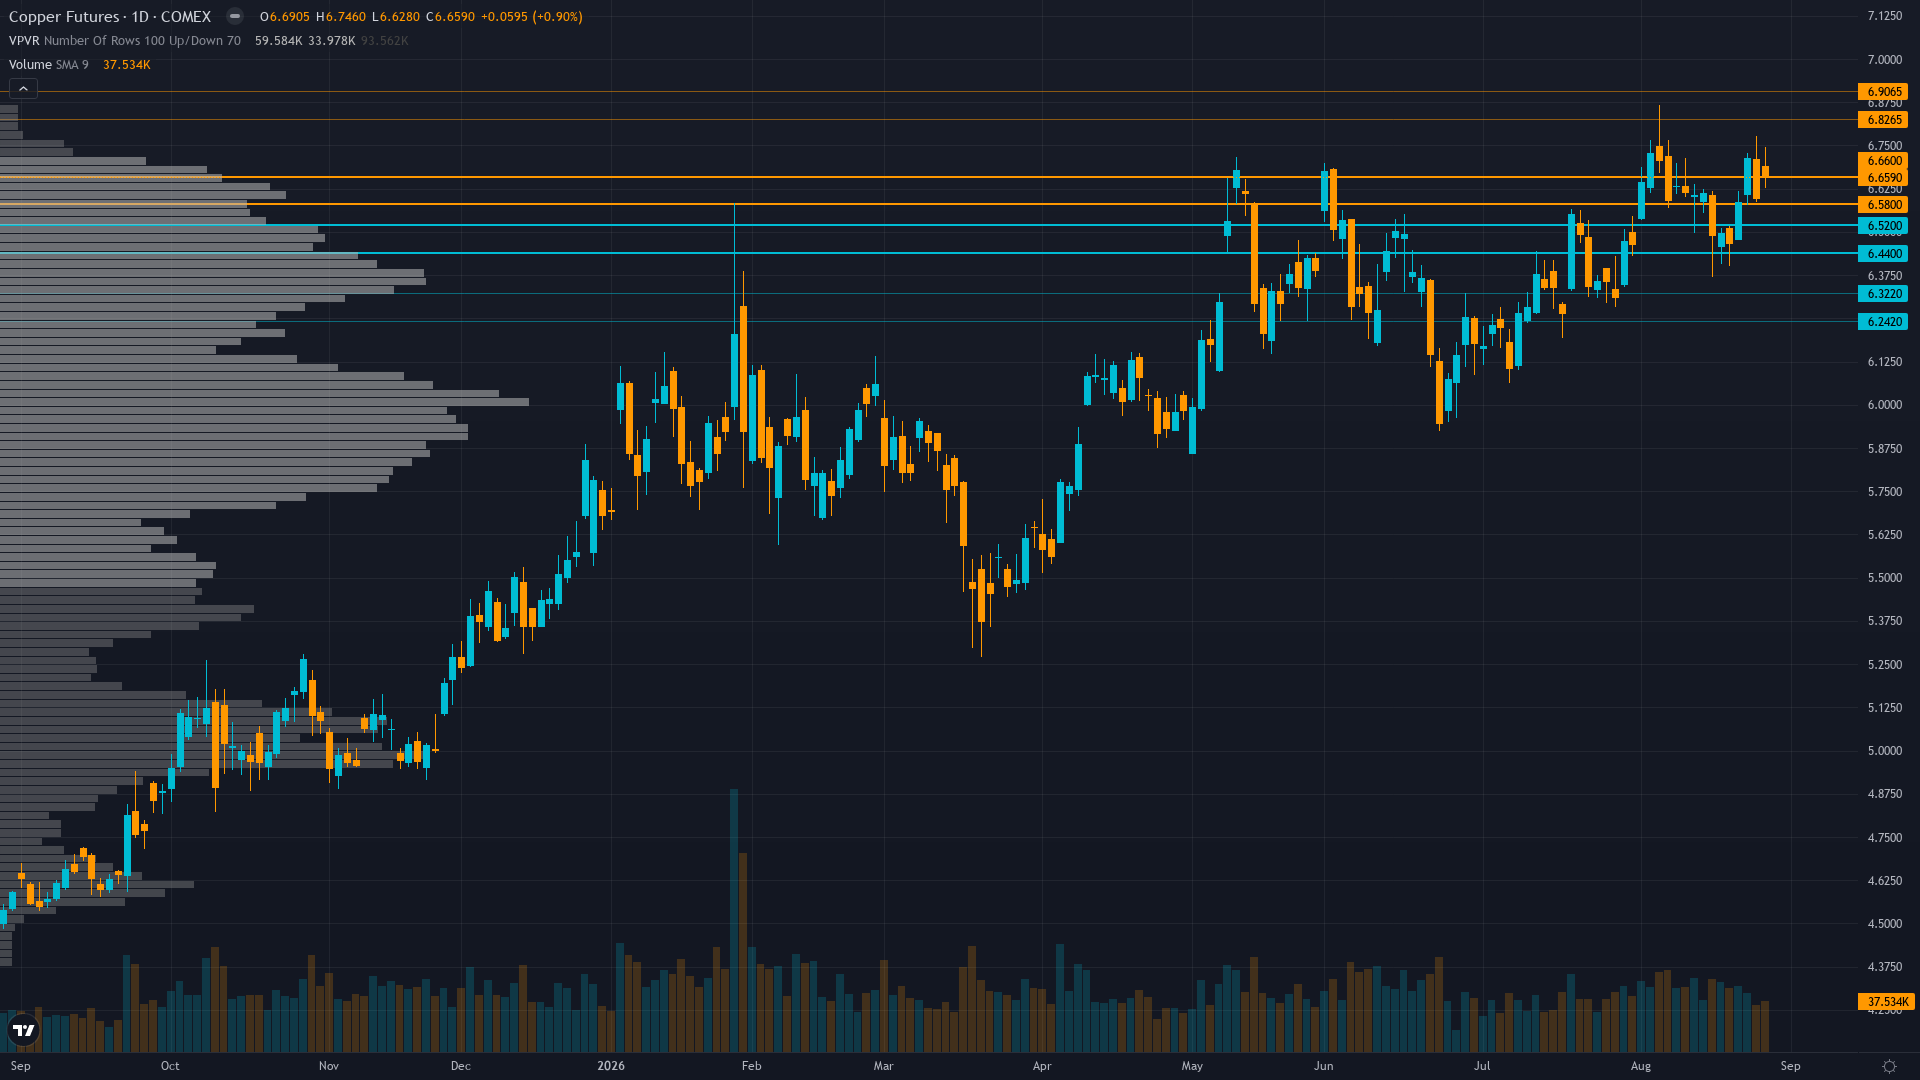
At 6.562, copper has eased 0.90% in a controlled retreat. Price action in copper futures has compressed into a consolidation pattern, typically a precursor to a directional breakout.
Copper consolidating near 52-week highs supported by structural supply deficit and AI demand themes but extreme speculative positioning at 99.4th percentile COT and fresh LME inventory build of 63,000 tonnes creating tactical uncertainty ahead of China PMI catalyst on Aug 31
Forces in Play
Primary driver: Extreme institutional positioning at 99.4th percentile COT (85,266 net long contracts) conflicts with improving Chinese demand expectations ahead of Aug 31 NBS Manufacturing PMI, creating analytical paralysis that prevents directional conviction
Secondary factor: China NBS Manufacturing PMI (Aug 31 est 49.7 vs prev 49.2) and US ISM Manufacturing PMI (Sep 1 est 55.3 vs prev 55.6) represent binary demand catalysts for world's 50% copper consumer, with potential to resolve current deadlock between fundamental bullish forces and extreme speculative crowding
Additional influence: LME inventories at 238,575 tonnes after 63,000-tonne August surge have eased physical tightness and narrowed backwardation since mid-August, temporarily offsetting structural supply deficit narrative from Chile/Peru disruptions
Economic backdrop: RISK-ON macro regime with VIX at 14-15, Fed on hold at 3.63%, US 10Y at 4.73%, inflation at 2.31%, recession probability at 0.6%, with critical China NBS Manufacturing PMI (Aug 31 est 49.7) and US ISM Manufacturing (Sep 1 est 55.3) as imminent demand catalysts
Fundamental assessment: Structural deficit remains intact with supply disruptions in Chile (storms) and Peru (MMG mine halt) tightening mine supply, but LME inventories surged 63,000 tonnes in late August to 238,575 tonnes, temporarily easing near-term physical tightness and narrowing backwardation
Technical Landscape
Price at $6.562 consolidating near 52-week highs at 93.4% range position, trading above 50-day and 200-day moving averages with RSI at 58.5 showing neutral-bullish momentum, immediate resistance at $6.62-$6.68 and major resistance at $6.87 (52-week high)
Trend strength registers at 6/10, suggesting meaningful but not extreme directional bias.
Risk-Reward Assessment
Primary risk: Non-commercial net long at 99.4th percentile 3-year extreme creates acute forced liquidation risk if China Aug 31 NBS Manufacturing PMI disappoints below 49.0, triggering cascading speculative long unwind from 85,266 contracts toward $6.105 major support representing 7.0% downside (Probability: medium)
Primary opportunity: If China NBS Manufacturing PMI surprises above 50.0 confirming expansion and US ISM Manufacturing holds above 55, the structural deficit thesis reasserts driving breakout above $6.62 resistance toward $6.87 52-week high as extreme COT positioning is validated by fundamental demand rather than reversed (Timeframe: 1-3 weeks as Aug 31 China PMI, Sep 1 US ISM, and Sep 3 US jobs data create sequential catalyst resolution window with seasonal tailwind from Aug-Dec period historically averaging +8.37% with 80% win rate)
This week's edge: Below signal threshold — range-bound assessment with catalyst pending. The market faces a genuine three-way tension between extreme institutional crowding (99.4th percentile COT), easing physical tightness from the 63,000-tonne LME inventory build, and an impending seasonal tailwind (Aug-Dec +8.37% with 80% win rate). The Aug 31 China PMI represents the binary resolution that will determine which force dominates.
Risk Environment
With vol at the 52th percentile over 90 days, copper price is in a measured regime that doesn't require unusual adjustments. Volatility is contracting, with realised vol declining across timeframes. Compressed volatility often precedes sharp directional moves as energy builds.
Current 16.6% realised vol suggests daily ranges of 1.5-2.0% below the 2.69% average weekly move for HG, reflecting controlled consolidation with $6.48-$6.62 defining the immediate range; vol contraction indicates a coiled spring setup where Aug 31 China PMI likely triggers 3-5% directional expansion
Seasonal Context
Historically, August 2026 has been a headwind for COMEX copper, with seasonal data showing a 42% win rate. Seasonal demand trough.
Week Ahead Outlook
The next major catalyst is China NBS Manufacturing PMI (Aug) at 01:30 UTC - estimate 49.7 vs previous 49.2, representing critical demand signal for world's 50% copper consumer and potential resolution for current analytical deadlock on Monday 31 August — a high-impact event that could materially shift the directional picture.
For copper, the balance between existing momentum and scheduled risk events sets the stage for the week ahead.
This analysis covers one dimension. Our full weekly report combines six specialist agents into a single actionable briefing with directional bias, key levels, and risk-opportunity matrix.
Start Free — Get the Market of the WeekFree weekly report · No credit card · Upgrade anytime



