Copper Forecast This Week — Outlook, Drivers & Key Levels
This week's Copper outlook: key drivers, volatility context, risk-opportunity assessment and the week ahead.

Current Market Picture
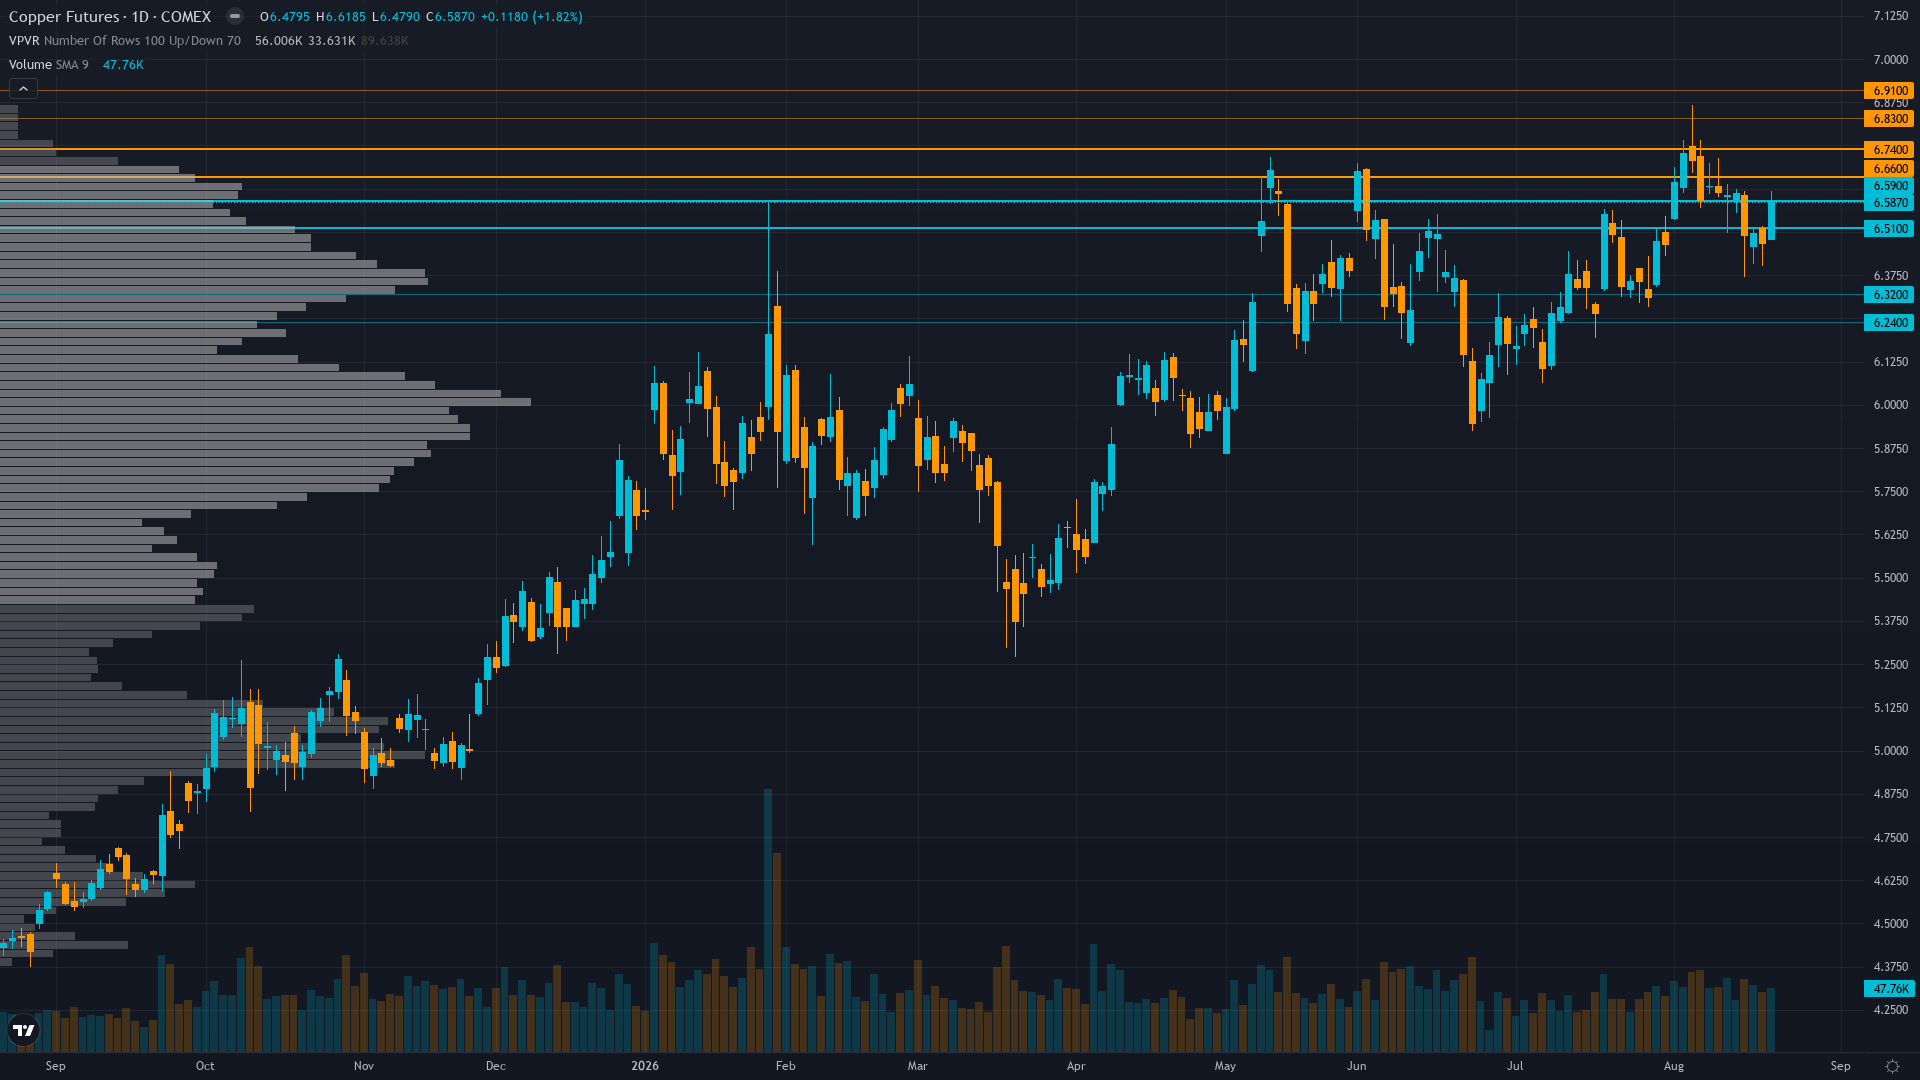
copper stands at 6.5795, having rallied 1.85% as bulls press their advantage. The market in copper futures is coiling, with narrowing price ranges suggesting stored energy that will eventually release.
Copper consolidating near 52-week highs supported by structural supply deficit and AI demand themes but extreme speculative positioning at 98.7th percentile COT and fresh LME inventory build of 63,000 tonnes create tactical uncertainty ahead of China PMI catalyst on Aug 31
Key Drivers This Week
Primary driver: Extreme institutional positioning at 98.7th percentile COT (79,748 net long contracts) conflicts with fresh LME inventory build of 63,000 tonnes Aug 17-19, creating analytical paralysis that prevents directional conviction
Secondary factor: Seasonal inflection point reached — copper historically averages +8.37% from Aug 19 to Dec 31 with 80% win rate (Seasonax), but this statistical pattern is untestable against the extreme COT crowding
Additional influence: Upcoming dual catalyst window: US CB Consumer Confidence (Aug 25), Core PCE and Durable Goods (Aug 26), and critically China NBS Manufacturing PMI (Aug 31, est 49.9 vs 49.2 prior) representing binary demand resolution for world's 50% copper consumer
Economic backdrop: RISK-ON macro regime with VIX at 15.87, credit spreads at 271bps tightening, Fed at 3.63% with hold expected through 2026, US 10Y at 4.74% (+6bp on week providing modest headwind), recession probability at 0.6%, China NBS Manufacturing PMI Aug 31 expected at 49.9 vs 49.2 prior improving from contraction territory
Fundamental assessment: Structural deficit of ~600kt for 2026 per ING forecasts remains intact but visible inventories have nearly doubled YoY to 962,000 tonnes across major exchanges, and the fresh 63,000-tonne LME build narrows backwardation, suggesting near-term supply adequacy despite longer-term structural tightness
Price Structure
Price at $6.58 consolidating near 52-week highs at 94.6% range position, trading above 50-day and 200-day moving averages with RSI ~60-65, immediate resistance at $6.62 (daily high) and major resistance at $6.8665 (52-week high), support at $6.48 (daily low) and $6.282 (Elliott invalidation level)
Trend strength sits at 6/10, reflecting a market that has directional bias but hasn't reached extreme conviction.
Upside & Downside
Primary risk: Non-commercial net long at 98.7th percentile 3-year extreme creates acute forced liquidation risk if China Aug 31 NBS Manufacturing PMI disappoints below 49.0, combined with LME inventory build of 63,000 tonnes easing physical scarcity narrative, triggering cascading speculative long unwind from 79,748 contracts toward $6.28 major support representing 4.6% downside (Probability: medium)
Primary opportunity: Seasonally powerful window opens Aug 19-Dec 31 with historical +8.37% average return and 80% win rate (Seasonax 10-year data), and if China Aug 31 NBS Manufacturing PMI surprises above 50.5 confirming manufacturing recovery with new orders expansion, the structural deficit thesis reasserts driving breakout above $6.62 resistance toward $6.8665 52-week high as extreme COT positioning is validated by fundamental demand rather than reversed (Timeframe: 1-3 weeks as Aug 25-26 US data, Aug 31 China PMI, and mid-September FOMC create sequential catalyst resolution, with seasonal tailwind Aug 19-Dec 31 providing structural bullish skew)
This week's edge: Below noise threshold — range-bound assessment. The market is experiencing a genuine three-way tension between extreme institutional crowding (98.7th percentile COT), fresh physical easing from the 63,000-tonne LME inventory build, and an impending seasonal tailwind (Aug 19-Dec 31 averaging +8.37% with 80% win rate). No single factor dominates sufficiently to justify directional conviction above the signal threshold.
Volatility Context
At the 62th percentile, copper price volatility sits in a normal range, neither compressed enough to signal a breakout nor elevated enough to demand caution. Realised vol is declining steadily, compressing into ranges that tend to snap when a catalyst breaks the equilibrium.
Current 17.1% realised vol suggests daily ranges of 1.5-2.0% below the 2.69% average weekly move for HG, reflecting controlled consolidation with $6.48-$6.62 defining the immediate range; vol contraction indicates a coiled spring setup where Aug 31 China PMI likely triggers 3-5% directional expansion
Seasonal Patterns
The seasonal picture for COMEX copper turns negative in August 2026 (42% win rate). Seasonal demand trough.
Looking Forward
All eyes turn to US CB Consumer Confidence (Aug) at 14:00 UTC - estimate 90.3 vs prior 90.8, providing first major US sentiment data point for the week ahead of Aug 26 Core PCE and Durable Goods on Tuesday 25 August, which carries enough weight to force a decisive directional move.
The week ahead for copper price hinges on whether the prevailing consolidating regime can absorb the scheduled catalysts without a regime shift.
This analysis covers one dimension. Our full weekly report combines six specialist agents into a single actionable briefing with directional bias, key levels, and risk-opportunity matrix.
Start Free — Get the Market of the WeekFree weekly report · No credit card · Upgrade anytime



