Copper Forecast This Week — Outlook, Drivers & Key Levels
This week's Copper outlook: key drivers, volatility context, risk-opportunity assessment and the week ahead.

Current Market Picture
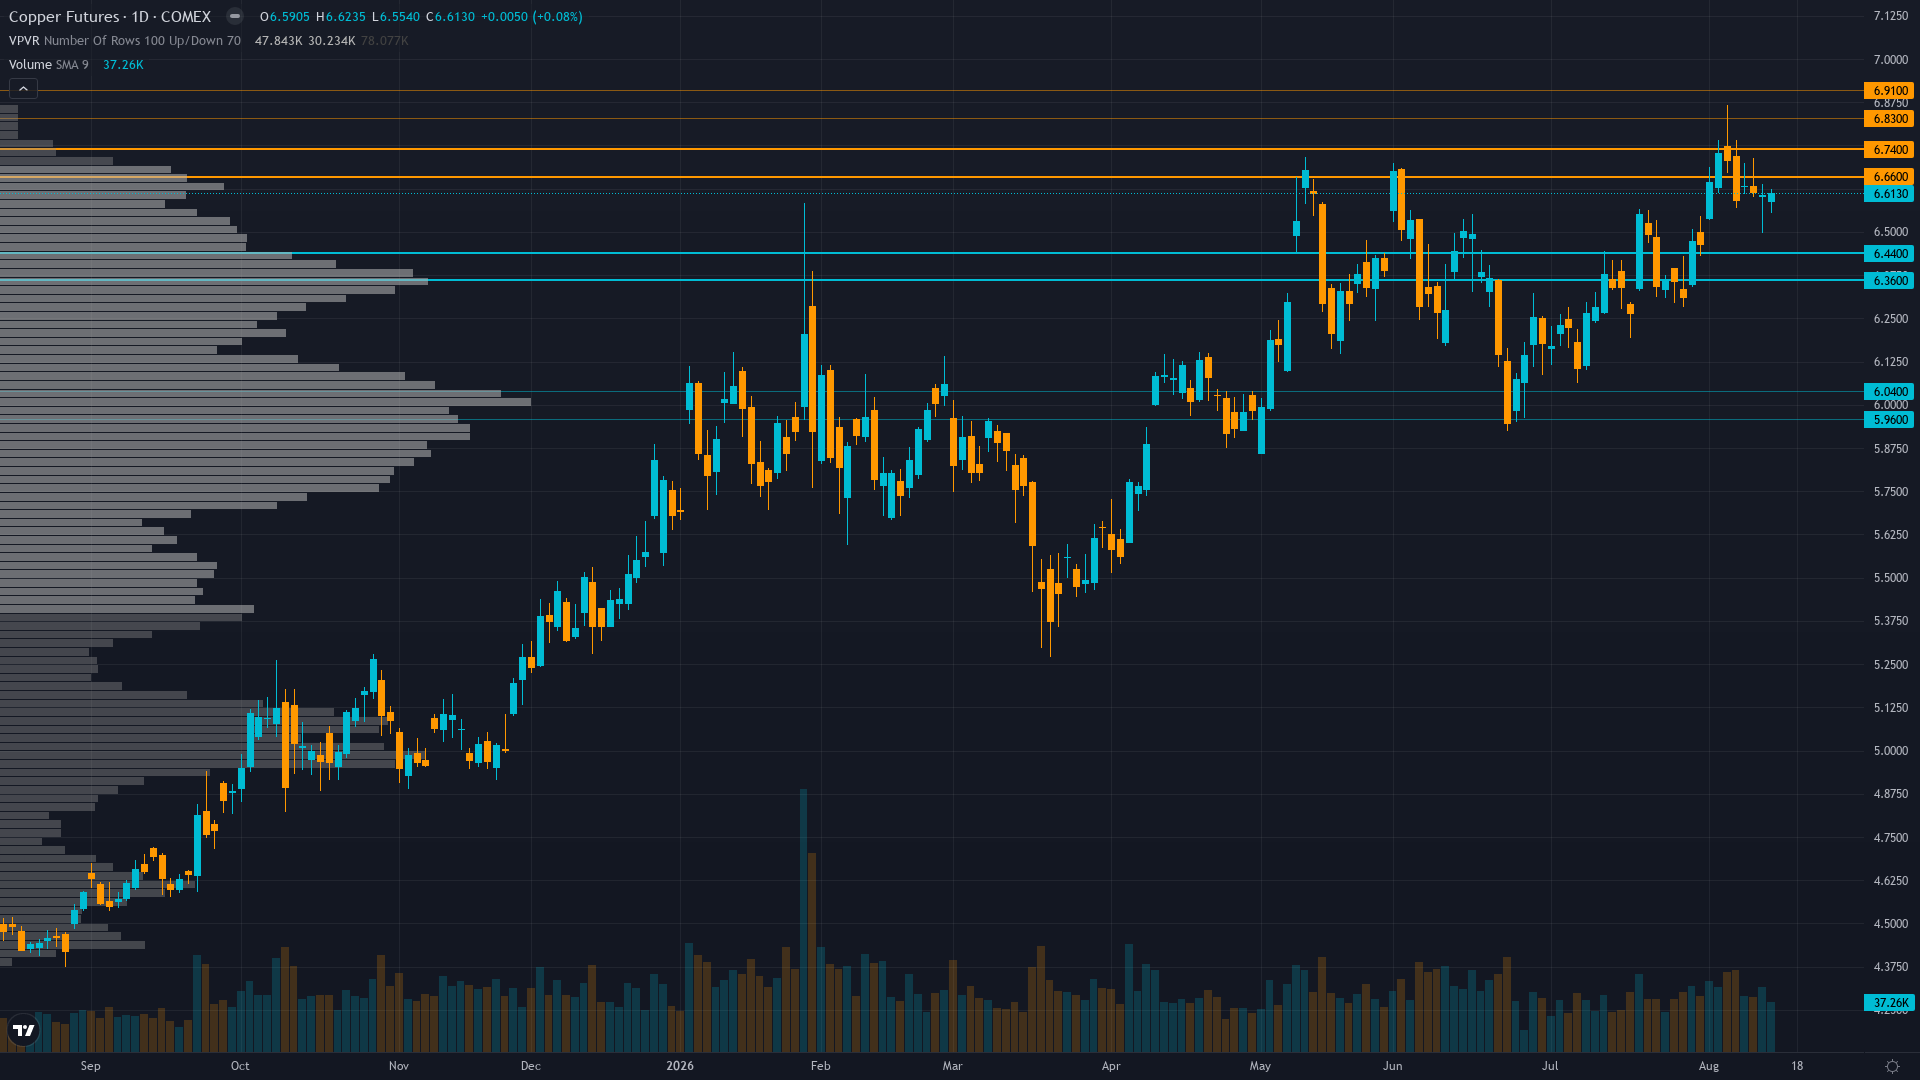
copper sits at 6.5995 after slipping 0.05% — a shallow pullback rather than a decisive move. The market in copper futures is coiling, with narrowing price ranges suggesting stored energy that will eventually release.
Copper trading near record highs supported by structural supply deficit and AI/data center demand narrative, but extreme speculative positioning at 99.4th percentile COT and imminent China demand data create binary risk for August
Key Drivers This Week
Primary driver: Structural supply deficit intact with LME inventories at 204,975 tonnes and fresh supply disruptions (Indonesia Gresik smelter boiler failure Aug 11, DRC export bans, Chilean storm impacts) validating physical scarcity despite extreme speculative positioning at 99.4th percentile COT
Secondary factor: China July Industrial Production and Retail Sales data due Aug 17 represents binary demand catalyst — market estimates IP at 5.0% YoY (vs prior 5.3%) and Retail Sales at 1.5% (vs 1.0%), with weaker prints risking demand destruction narrative overwhelming supply deficit thesis
Additional influence: Non-commercial net long at 80,388 contracts at 99.4th percentile of 3-year range represents extreme speculative crowding creating acute mean reversion risk that conflicts with genuine physical scarcity evidence from backwardation and inventory drawdowns
Economic backdrop: RISK-ON macro regime with VIX at 14.25-15.15, Fed at 3.63%, US 10Y at 4.68%, China data releases Aug 17 critical for demand validation, FOMC minutes Aug 19 and Housing Starts Aug 18 as secondary catalysts
Fundamental assessment: Structural supply deficit with 600kt projected deficit for 2026, copper moderately undervalued by 5-8% vs marginal production costs, fresh supply disruptions from Indonesia Gresik smelter failure (Aug 11), DRC export bans, and Chilean mine disruptions tightening physical availability
Price Structure
Price at $6.5995 consolidating near yearly highs, trading above 50-day and 200-day moving averages at 95.5% of 52-week range, RSI elevated above 60 with momentum confirming uptrend, immediate resistance at $6.70 psychological round number
Trend strength sits at 7/10, reflecting a market that has directional bias but hasn't reached extreme conviction.
Upside & Downside
Primary risk: Weak China July data (IP below 4.5%, Retail Sales below 1.0%) could trigger cascading speculative liquidation from extreme COT positioning at 99.4th percentile, with 80,388 net longs vulnerable to forced unwinding toward $6.28 major support representing 4.8% downside (Probability: medium)
Primary opportunity: China data beats expectations (IP above 5.5%, Retail Sales above 2.0%) combined with fresh Gresik smelter supply disruption and LME inventory drawdown validates structural deficit thesis, driving breakout above $6.70 resistance toward 52-week high $6.87 as extreme COT positioning is validated by fundamentals rather than reversed (Timeframe: 1-3 weeks as Aug 17 China data provides directional catalyst resolution, with FOMC minutes Aug 19 and LME stock data providing secondary confirmation signals)
This week's edge: Market may be overweighting extreme COT positioning (99.4th percentile) as contrarian reversal signal while underweighting that fresh August 11 Gresik smelter failure in Indonesia, DRC export bans, and ongoing Chilean mine disruptions represent physical supply tightening that justifies elevated speculative longs, with China Aug 17 data creating asymmetric catalyst risk that could validate structural deficit thesis and trigger breakout above $6.70 resistance toward $6.87
Volatility Context
At the 62th percentile, copper price volatility sits in a normal range, neither compressed enough to signal a breakout nor elevated enough to demand caution. Realised vol is holding its current level, suggesting the market has found a temporary equilibrium in its risk pricing.
Current normalised volatility with daily ranges of 1.5-2.5% reflects controlled consolidation near yearly highs, with $6.55 support and $6.70 resistance defining the immediate range, flat term structure plus extreme COT positioning creating binary setup where Aug 17 China data likely triggers 3-5% directional move
Seasonal Patterns
The seasonal picture for COMEX copper turns negative in August 2026 (42% win rate). Seasonal demand trough.
Looking Forward
All eyes turn to China July Industrial Production YoY (est 5.0% vs prior 5.3%), Retail Sales YoY (est 1.5% vs prior 1.0%), and Fixed Asset Investment data representing critical demand validation for world's 50% copper consumer on Monday 17 August, which carries enough weight to force a decisive directional move.
The week ahead for copper price hinges on whether the prevailing consolidating regime can absorb the scheduled catalysts without a regime shift.
This analysis covers one dimension. Our full weekly report combines six specialist agents into a single actionable briefing with directional bias, key levels, and risk-opportunity matrix.
Start Free — Get the Market of the WeekFree weekly report · No credit card · Upgrade anytime



