Copper Forecast This Week — Outlook, Drivers & Key Levels
This week's Copper outlook: key drivers, volatility context, risk-opportunity assessment and the week ahead.

Market Overview
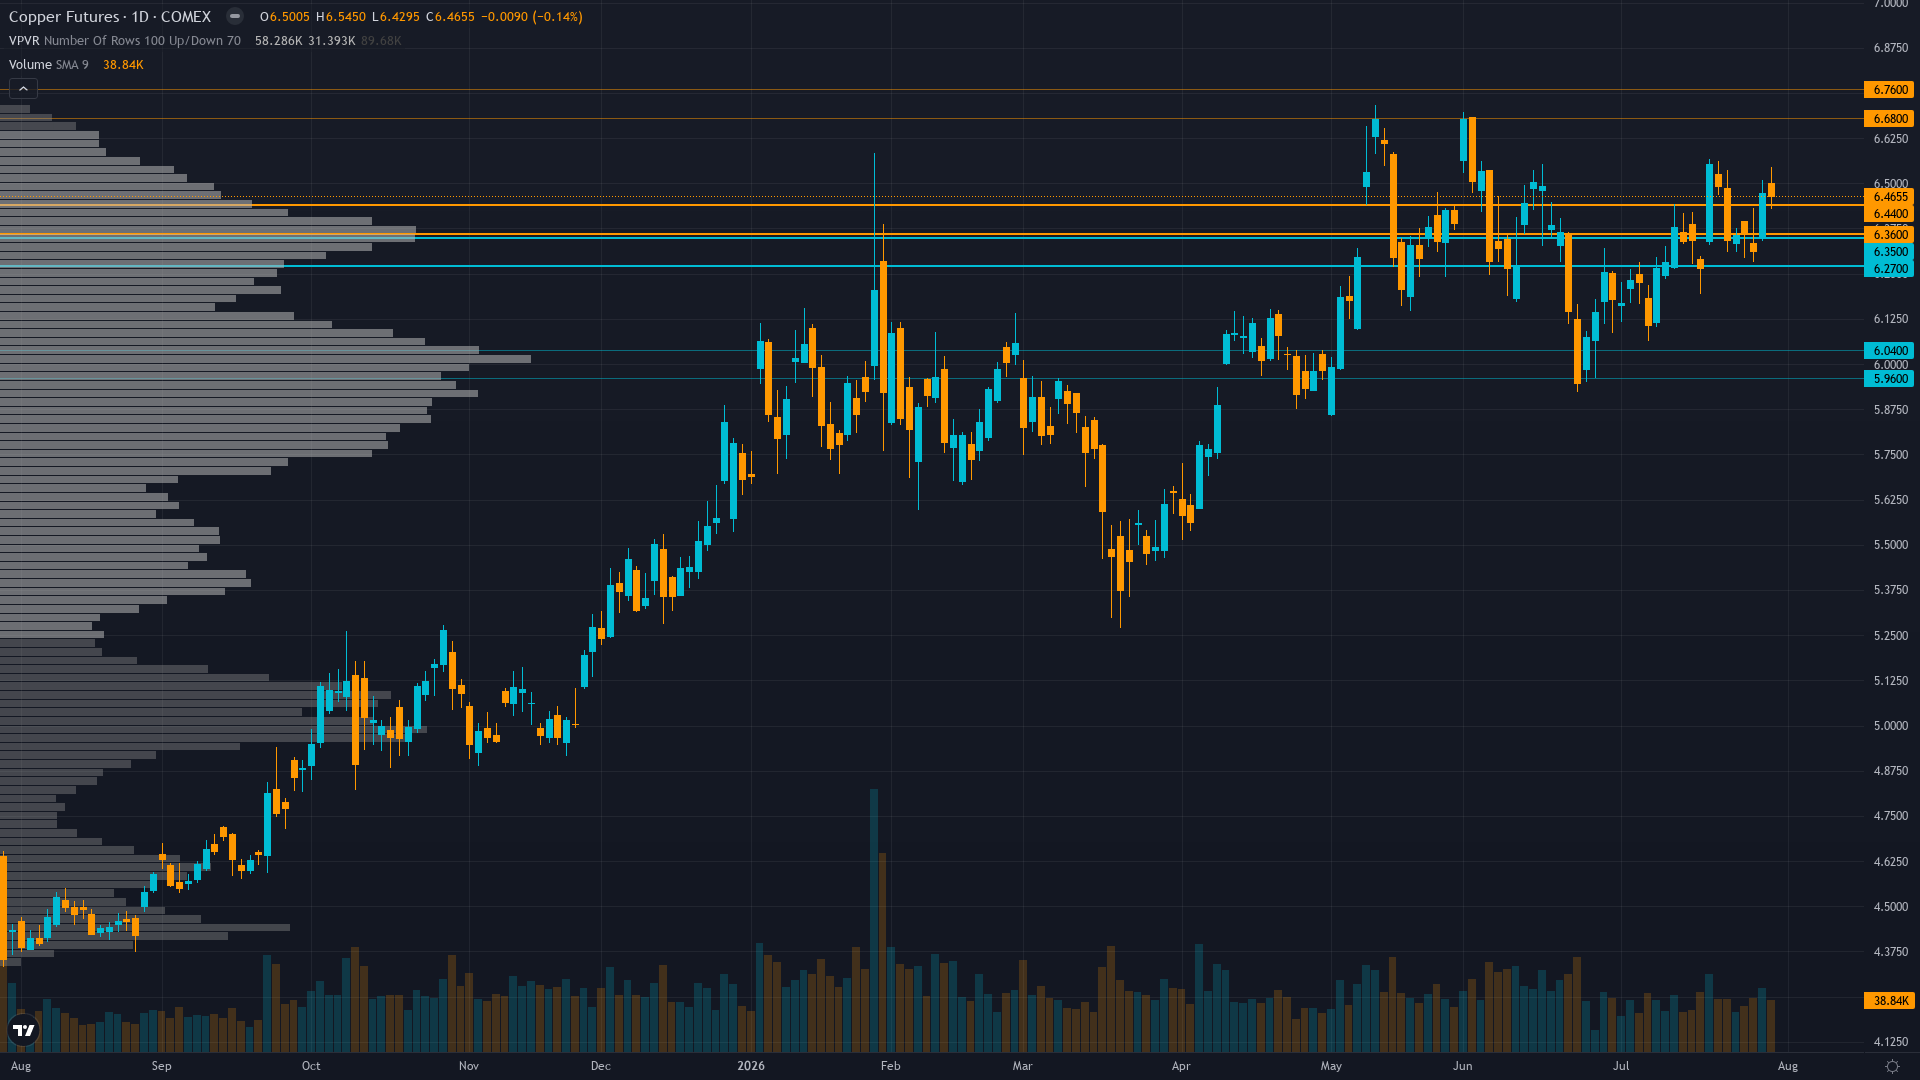
copper is trading at 6.51, up 2.06% in the last 24 hours as buyers maintain control. copper futures remains in trend mode, where following the prevailing direction has been the path of least resistance.
Copper trading near 2026 highs supported by structural supply deficit and physical inventory tightness but facing seasonal August weakness headwinds and valuation concerns as market awaits China July PMI catalyst for directional confirmation
This Week's Catalysts & Drivers
Primary driver: Structural supply deficit from Grasberg mine offline through Q2 2026, LME available inventory critically tight at 89,725 tonnes, and China July import demand sustaining nine-month highs with Yangshan premium at $115/ton validates physical scarcity narrative overriding seasonal August weakness headwinds
Secondary factor: Five consecutive CORRECT graded calls (July 31 BULLISH +2.61%, July 24 NO CALL +1.0%, July 17 NO CALL -0.27%, July 10 BULLISH +1.04%, July 3 NO CALL +1.37%) establish the strongest analytical track record of the past 6 months, providing conviction credibility to extend directional assessment
Additional influence: Five of six disciplines signal BULLISH or mildly BULLISH (Fundamental +1/6, Technical +2.5/7, Institutional 0/3, Options 0/3, Sentiment +0.5/4) versus one NEUTRAL (Economic +0.5/6), creating 83% directional agreement weighted toward the highest-conviction Technical and Fundamental disciplines showing fresh catalyst alignment post-July 30-31 FOMC and China PMI resolution
Economic backdrop: Fed on hold at 3.50-3.75% range after July 30-31 FOMC meeting (3 days ago), VIX at 15.99 comfortably below 20 confirming RISK-ON macro regime, China July PMI release expected imminently representing critical demand validation for world's 50% copper consumer after June 50.0 tepid reading
Fundamental assessment: Structural supply deficit intact with ICSG 150,000-tonne deficit forecast for 2026, LME available inventory at critically low 89,725 tonnes, Chile winter storm disruptions and Codelco production challenges maintaining supply tightness despite Goldman Sachs valuation concern at $12,600/MT vs $11,000 year-end target
Technical Picture
Price at $6.51 trading well above 50-day and 200-day moving averages confirming strong uptrend, having broken above recent $6.36 consolidation to approach 52-week high of $6.716, with RSI likely neutral-bullish and momentum trending higher on the daily timeframe
At 7/10, trend strength indicates a solid directional lean without being overextended.
Bull & Bear Case
Primary risk: China July PMI disappointing below 50 expansion threshold confirming June 50.0 was peak not floor, validating that high-tech manufacturing strength has not translated to broader copper-intensive sectors, triggering profit-taking from current $6.51 levels as August seasonal weakness historically averages -4.11% with 26.67% win rate over last 20 years (Probability: medium)
Primary opportunity: China July PMI surprise above 51.0 validating economic stabilization coupled with ongoing supply tightness from Chile disruptions and LME inventory critically low drives breakout above $6.55 immediate resistance toward January $6.72 all-time highs as structural deficit narrative reasserts pricing power despite seasonal August headwinds (Timeframe: 1-3 weeks as August China PMI catalyst (next 1-3 days) provides directional resolution, with Codelco full-year production guidance and Chile winter recovery timeline determining whether supply scarcity premium expands or contracts through August)
This week's edge: Market may be overweighting August seasonal weakness (historically worst month for copper with -4.11% average return and 26.67% win rate) and Goldman Sachs' valuation concern at $12,600/MT vs $11,000 target while underweighting that LME available inventory at critically low 89,725 tonnes and ongoing Chile supply disruptions from winter storms provide FRESH physical scarcity evidence that seasonal patterns alone cannot override, with five consecutive correct graded calls providing analytical credibility to extend bullish thesis into August as China July PMI catalyst approaches
Volatility Regime
Volatility for copper price is at the 62th percentile over 90 days — a normal regime that allows for standard position sizing and conventional trade management. The vol trend is flat, with no meaningful shift across timeframes. Stable vol environments often lull traders before a regime change arrives.
Current 28.5% short-term volatility suggests daily ranges of 2-3% versus normal 1.5-2% for copper, August opening with price at $6.51 showing controlled upward bias after breaking above $6.40 resistance, flat term structure plus moderate institutional positioning creates balanced setup where China July PMI likely triggers 3-5% directional move resolving current range
What History Shows
COMEX copper faces seasonal pressure in August 2026 — historical patterns show a 42% win rate to the downside. Seasonal demand trough.
The Week Ahead
China July Manufacturing PMI release (official NBS and Caixin) representing critical demand validation after June 50.0 barely expansionary reading, determining whether industrial metals demand recovery is intact or deteriorating on Monday 3 August is a high-impact catalyst with the potential to redefine the near-term outlook entirely.
How copper futures navigates the confluence of trending conditions and incoming data will determine whether the current directional thesis holds or breaks.
This analysis covers one dimension. Our full weekly report combines six specialist agents into a single actionable briefing with directional bias, key levels, and risk-opportunity matrix.
Start Free — Get the Market of the WeekFree weekly report · No credit card · Upgrade anytime



