S&P 500 Forecast This Week — Outlook, Drivers & Key Levels
This week's S&P 500 outlook: key drivers, volatility context, risk-opportunity assessment and the week ahead.

Current Market Picture
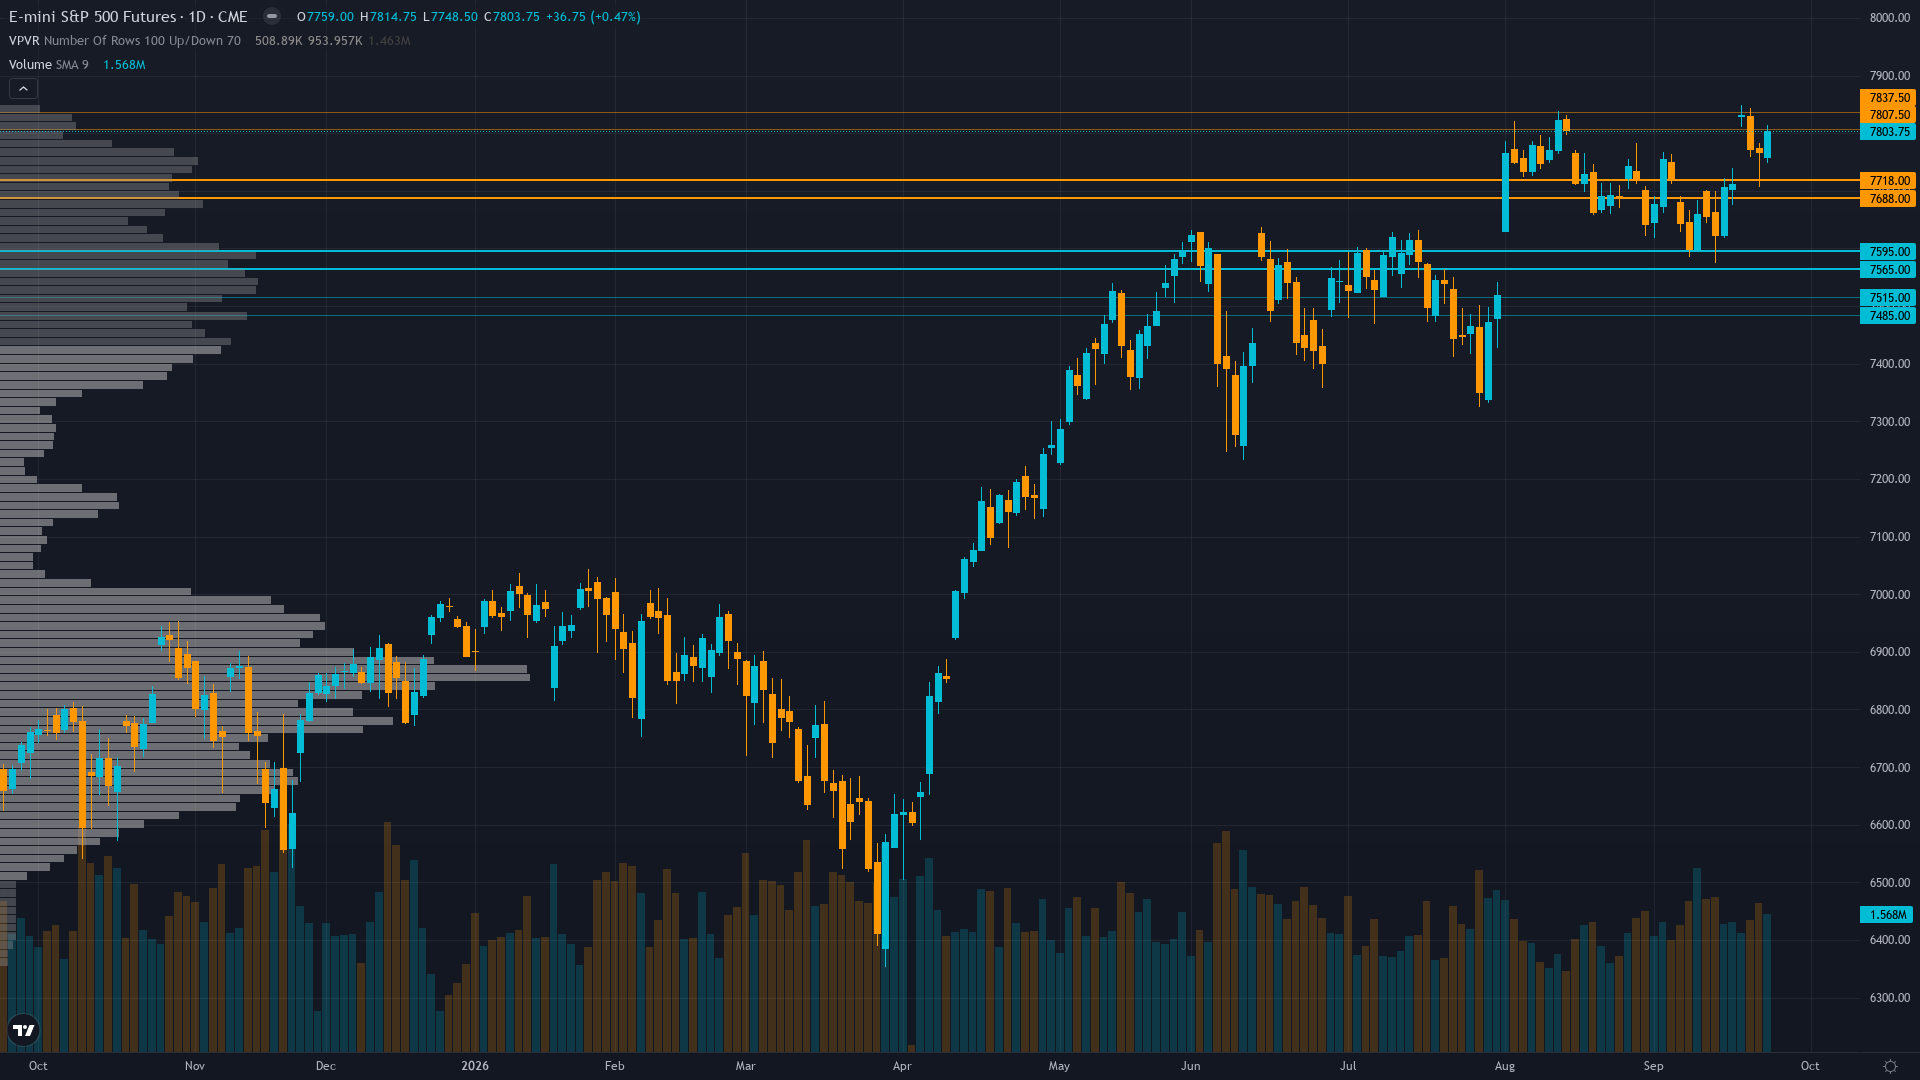
Trading at 7803.75 with a 0.47% uptick, S&P 500 is drifting higher without strong conviction. The market in S&P 500 futures is coiling, with narrowing price ranges suggesting stored energy that will eventually release.
Cautiously bullish as ES approaches all-time highs at 7,833.5 supported by AI optimism and strong earnings trajectory, with quarter-end flows expected to provide mechanical support, but elevated 10Y yields at 5.17%, oil price pressures, and the Sep 28-29 data/Fed speech cluster creating two-way event risk into month-end
Key Drivers This Week
Primary driver: ES rallied +1.91% to 7,803.75 in the week ended Sep 25, trading at 97.9% of the 52-week range (ATH 7,833.5) as technology shares led gains on fresh AI optimism despite a surge in 10-year Treasury yields to 5.17% and oil price pressures, with quarter-end window dressing flows expected Sep 28-30 providing mechanical institutional buying support
Secondary factor: CFTC COT data Sep 22 shows non-commercial net short surged to -133,228 contracts (32.3rd percentile) after a -32,767 contract single-week increase — the largest one-week speculative short build since the Aug 25 surge of -57,434 contracts — creating powerful short-squeeze asymmetry as ES trades near all-time highs with 1.90M open interest, though the net short at only the 32.3rd percentile of the 3-year range limits the extremity of the contrarian signal
Additional influence: 10-year yield at 5.17% (up 16bp in one week per US Treasury data Sep 25) and 30-year at 5.49% (up 15bp) mark multi-decade highs that are compressing equity risk premia, yet the S&P 500 absorbed this with a +0.50% day on Sep 25 as technology shares (Microsoft +4%) rallied, supporting the interpretation that higher yields reflect growth validation rather than inflation panic, though the 2s10s curve at +36bp confirms a steepening growth narrative
Economic backdrop: Fed on hold at 3.63% (Aug 2026), inflation stable at 2.34%, unemployment 4.1%, retail sales at $668.9B (up 1.2% MoM) showing consumer resilience, recession probability at 0.76% (Jul 1); AI infrastructure capex cycle accelerating with hyperscalers projected to spend $775-800B in 2026; upcoming catalysts: JOLTs Job Openings (Aug) Sep 29 est 7.23M, CB Consumer Confidence Sep 29 est 90, multiple Fed speeches Sep 28-29 including Bowman, Barkin, Goolsbee, Williams, Waller
Fundamental assessment: S&P 500 forward P/E at 25.9x modestly above long-term average of 25.41x but justified by 12 consecutive quarters of profit expansion and Q3 2026 projected at 28.9% YoY growth (third straight quarter above 25%), though the elevated valuation creates execution risk if earnings fail to sustain this trajectory
Price Structure
Daily uptrend intact with ES at 7,803.75 above all key moving averages, positioned in 97.9th percentile of 52-week range (7,833.5 ATH), with positive momentum sustained but approaching major resistance at the all-time high; 7,675 August pivot provides immediate support, with negative gamma regime (-$5.6B GEX) potentially amplifying any directional move through month-end
Trend strength sits at 7/10, reflecting a market that has directional bias but hasn't reached extreme conviction.
Upside & Downside
Primary risk: 10-year yield sustained above 5.17% continues compressing equity risk premia and could trigger multiple compression for growth stocks if the catalyst cluster Sep 28-29 delivers hawkish Fed messaging or JOLTs data shows persistent labor tightness that pushes rate hike expectations higher, driving ES rejection at 7,833.5 ATH toward 7,675 support then 7,600 (Probability: medium)
Primary opportunity: Massive -32,767 contract speculative short build in one week to -133,228 net short creates significant short-covering squeeze potential — any positive catalyst from JOLTs, Consumer Confidence, or dovish Fed speeches Sep 28-29 could trigger violent squeeze through the 7,833.5 ATH toward 7,855-7,868 call wall resistance as quarter-end window dressing flows amplify mechanical buying (Timeframe: September 28 - October 2 2026)
This week's edge: Signal below Min Signal threshold — directional edge insufficient for bias. The market may be underweighting the speed and magnitude of the speculative short build (-32,767 contracts in one week to -133,228 net short) occurring precisely as ES approaches all-time highs, creating one of the most powerful short-squeeze setups in months, while simultaneously overpricing the significance of 10Y yields at 5.17% when the equity market has demonstrated consistent absorption capacity — the contained 3-month return of +5.43% and 1-week return of +1.91% against a 16bp yield surge argue that higher yields are being interpreted as growth validation, not a systemic risk to equity valuations
Volatility Context
At the 20th percentile, ES futures volatility is unusually subdued, creating conditions that historically precede sharp directional moves. Realised vol is declining steadily, compressing into ranges that tend to snap when a catalyst breaks the equilibrium.
Low volatility regime suggests 0.6-1.0% daily ES moves (~45-78 points) with 20-day realised vol at 12% pricing sub-0.75% one-standard-deviation daily moves. The Sep 28-29 data/Fed speech cluster creates potential for 1.5-2.5% directional expansion on data surprises or policy guidance shifts. Support 7,675 and resistance 7,833.5 define the key levels, with negative gamma (-$5.6B GEX) potentially amplifying any breakout or breakdown through month-end
Week Ahead Outlook
The next major catalyst is CB Consumer Confidence (Sep) estimate 90 vs previous 89.4 and JOLTs Job Openings (Aug) estimate 7.23M vs prior 7.271M — dual high-impact data releases testing consumer resilience and labor market conditions with multiple Fed speeches providing policy guidance on same day (Goolsbee, Williams, Waller, Bowman, Musalem) on Tuesday 29 September — a high-impact event that could materially shift the directional picture.
For S&P index, the balance between existing momentum and scheduled risk events sets the stage for the week ahead.
This analysis covers one dimension. Our full weekly report combines six specialist agents into a single actionable briefing with directional bias, key levels, and risk-opportunity matrix.
Start Free — Get the Market of the WeekFree weekly report · No credit card · Upgrade anytime



