Nasdaq 100 COT & Institutional Positioning — Smart Money Analysis
Nasdaq 100 institutional positioning: COT data, sentiment analysis and smart money flow assessment.

The Institutional Landscape
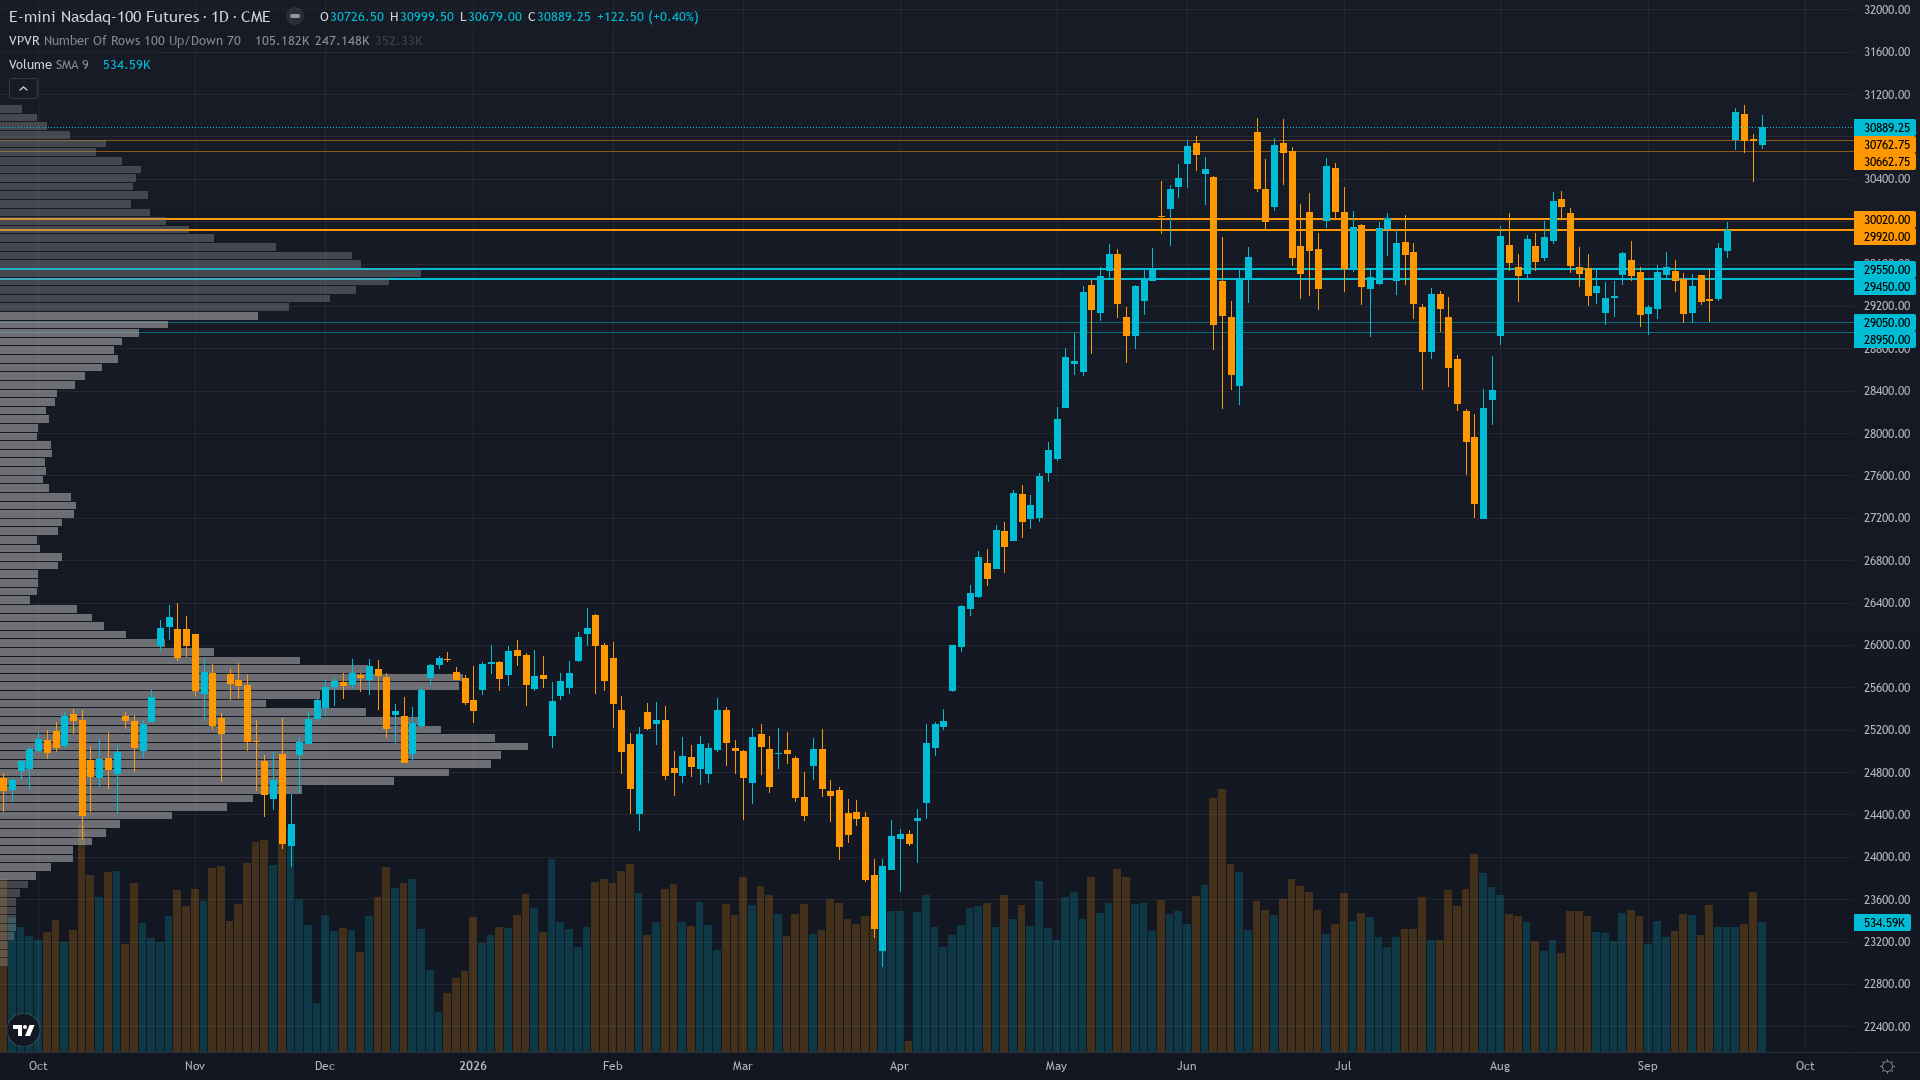
Nasdaq 100 holds at 30889.25, up a marginal 0.40% as the market grinds forward.
Extreme bullish crowding with non-commercial net longs at +56,150 contracts (98.7th percentile, 3Y range), representing a +22,432 contract weekly surge that signals aggressive speculative accumulation; this is the most extended net long positioning in the 158-week history and represents contrarian reversal risk as crowded trades are vulnerable to liquidation
Market Consensus vs Our Analysis
Market consensus: Bullish but cautious at extremes — consensus acknowledges the powerful AI-driven breakout and favorable macro backdrop while flagging the COT speculative positioning at 98.7th percentile and 5.17% 10Y yield as risks that warrant tactical prudence near ATH levels
Primary driver: 5-of-6 discipline bullish consensus converging on AI-driven structural rally as NQ surged +4.31% in the past week to 30,889.25, now at 98.2% of the 52-week range and within 139 points of the all-time high at 31,028.50, with Economic (+2.5, confidence 7) and Technical (+2.5, confidence 7) leading the constructive case
Contrarian Assessment
Mild divergence: the desk's BULLISH bias aligns with institutional consensus (COT at 98.7th percentile confirming bullish positioning) and most discipline agents, but the desk identifies the COT extreme as a material contrarian risk that consensus is underweighting — the market is fully positioned for continuation but not pricing the asymmetric reversal tail from record speculative crowding, particularly given NQ's historical 30% overshoot tendency in both directions
Sentiment & Positioning
Sentiment around Nasdaq 100 futures is neutral, with no extreme positioning on either side. This balanced state often resolves when a catalyst breaks the equilibrium.
Options Market Signal
VIX at 14.87 declining 5.11% indicating falling near-term volatility expectations; NQ ATM IV at ~21.3% elevated relative to 20-day realized vol of 17.9% suggesting options are pricing more volatility than recent actuals; positive gamma regime ($759.9M dealer long) providing structural stability with call wall at 29,590 and put wall at 29,000; declining VIX supports bullish continuation
Putting It Together
In summary, the positioning picture for Nasdaq 100 reflects fear conviction levels set against a trending market backdrop. With trend strength at 8/10, the prevailing move carries significant force behind it. The interplay between smart money activity, retail sentiment, and options market signals will shape how this positioning resolves.
This analysis covers one dimension. Our full weekly report combines six specialist agents into a single actionable briefing with directional bias, key levels, and risk-opportunity matrix.
Start Free — Get the Market of the WeekFree weekly report · No credit card · Upgrade anytime