Copper Forecast This Week — Outlook, Drivers & Key Levels
This week's Copper outlook: key drivers, volatility context, risk-opportunity assessment and the week ahead.

This Week's Starting Point
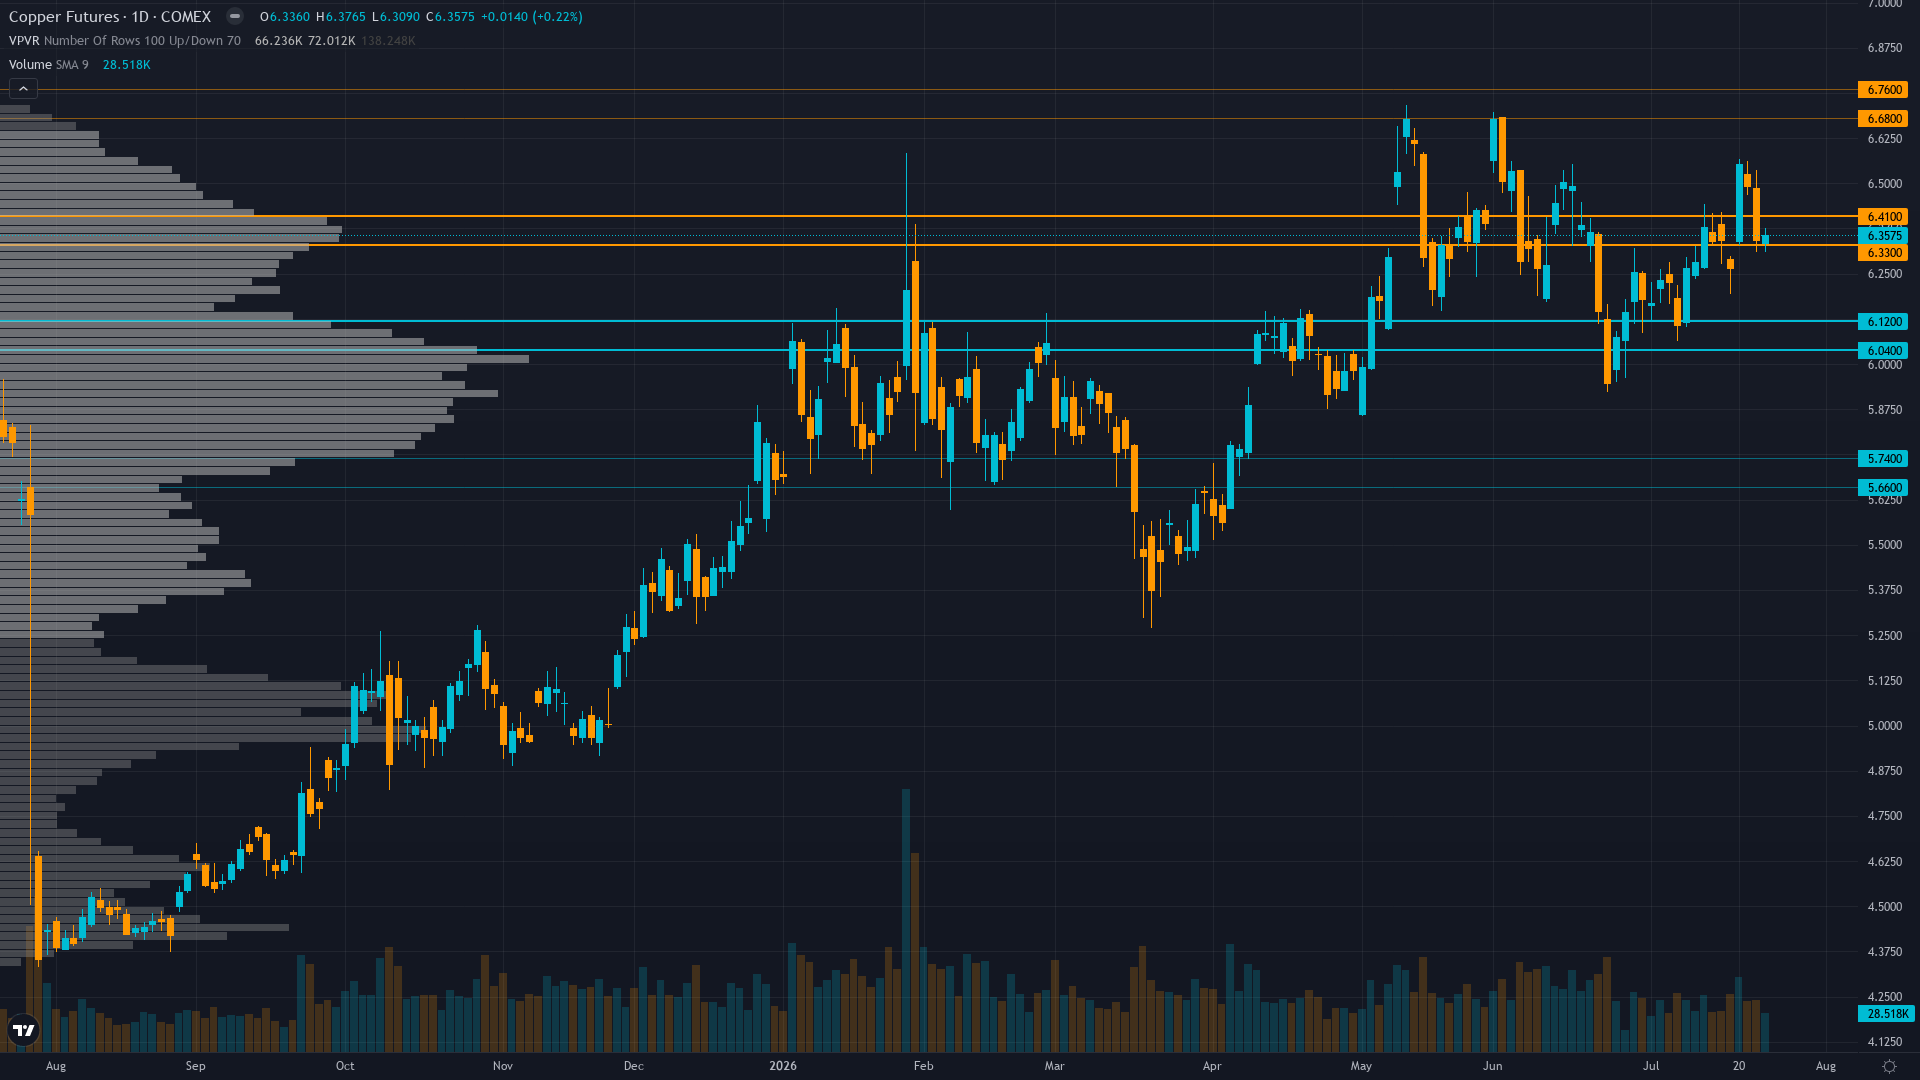
Trading at 6.36 with a 0.26% uptick, copper is drifting higher without strong conviction. Price action in copper futures has compressed into a consolidation pattern, typically a precursor to a directional breakout.
Copper consolidating from January 2026 record highs with elevated prices expected to persist supported by structural supply deficit fundamentals but near-term volatility likely as market balances Chile supply shock against China demand mixed signals with June PMI at 50.0 barely expansionary
Forces in Play
Primary driver: Chile winter storm disruption (July 14, 2026) affecting major mines combined with China import demand surging to nine-month high with Yangshan premium at $115/ton multi-year high validates fresh physical tightness narrative, overriding China June PMI weakness at 50.0
Secondary factor: Last four graded calls ALL CORRECT (July 24 NO CALL +1.0%, July 17 NO CALL -0.27%, July 10 BULLISH +1.04%, July 3 NO CALL +1.37%) resetting miss streak to zero and establishing analytical credibility to resume directional assessment at higher conviction levels
Additional influence: Five of six disciplines signal BULLISH or mildly BULLISH (Fundamental +2.5/7, Institutional +1.5/5, Options +0.5/4, Technical +0.5/5, Sentiment +0.5/4) versus one BEARISH (Economic -1.5/6), creating 83% directional agreement weighted toward top-weighted disciplines showing modest bullish confluence
Economic backdrop: Fed on hold with July 30-31 FOMC meeting expected (no change priced), China Manufacturing PMI weakened to 50.0 in June from 51.8 May (5-year high) showing expansion deceleration, consumer spending contracted YoY in May first time since pandemic, VIX 16.64 below 20 threshold confirming RISK-ON regime despite China demand headwinds
Fundamental assessment: Structural supply deficit intact with ICSG 150,000-tonne deficit for 2026, fresh Chile winter storm disruption July 14 affecting major mines, LME inventory critically low at 284,175 tonnes with available stock at 89,725 tonnes (lowest since July 2025), China July 20 import surge to nine-month high with Yangshan premium $115/ton validates demand floor despite June PMI weakness at 50.0
Technical Landscape
Daily consolidating at $6.36 near mid-range of $6.26-6.40 consolidation zone trading 5.4% below January $6.72 all-time high, RSI likely neutral 50-55 range showing balanced momentum, 52-week range $4.33-$6.72 places current at 85th percentile leaving 5.7% upside to record highs versus 5.7% downside to $6.00 psychological support
Trend strength registers at 6/10, suggesting meaningful but not extreme directional bias.
Risk-Reward Assessment
Primary risk: China July PMI (released around July 31, 5 days out) disappointing below 50 expansion threshold confirming June 50.0 reading was peak not sustained recovery, validating that high-tech equipment strength has not translated to broader copper-intensive sectors and triggering profit-taking from elevated +9.3% year-over-year price levels as demand destruction narrative gains credibility despite Chile supply disruption (Probability: medium)
Primary opportunity: Chile winter storm supply disruption persisting beyond initial July 14 event combined with China July PMI surprise above 51.5 confirming import surge to nine-month high represents genuine demand recovery not temporary stockpiling, driving breakout through $6.40 resistance toward January $6.72 highs as market reprices scarcity premium and fresh deficit reality validates structural bull case (Timeframe: 1-3 weeks as July 30-31 FOMC and July 31 China PMI create dual catalyst windows, with Chile mine production resumption status in next 1-2 weeks determining whether July 14 supply shock translates to sustained tightness or temporary noise)
This week's edge: Market may be overweighting China June PMI weakness at 50.0 as demand destruction signal while underweighting that July 20 China import surge to nine-month high with Yangshan premium at $115/ton multi-year high represents FRESH demand validation occurring 6 days ago, Chile July 14 winter storm disruption affecting major mines provides tangible supply shock not yet fully priced, available LME inventory at 89,725 tonnes lowest since July 2025 contradicts headline 284,175t stock levels, and July 30-31 dual catalysts potentially trigger breakout toward $6.40-6.72 resistance as deficit reality forces market repricing
Risk Environment
With vol at the 62th percentile over 90 days, copper price is in a measured regime that doesn't require unusual adjustments. Volatility is stable, with realised vol holding steady across timeframes. This equilibrium can persist but eventually resolves into expansion or contraction.
Current 28.5% short-term volatility suggests daily ranges of 2-3% versus normal 1.5-2% for copper, July consolidation showing controlled price action despite Chile July 14 disruption and China July 20 import surge indicating market hesitant to commit directionally ahead of July 30-31 catalyst window, flat term structure plus moderate institutional positioning creates balanced setup where catalysts likely trigger 4-6% move resolving current $6.26-6.40 range compression
Seasonal Context
Historically, July 2026 has been a headwind for COMEX copper, with seasonal data showing a 45% win rate. Summer demand slowdown begins.
Week Ahead Outlook
The next major catalyst is FOMC decision July 30-31 (hold expected but Chair Powell guidance could shift dollar trajectory) and China July PMI release around July 31 representing critical demand validation for world's 50% copper consumer after June 50.0 tepid reading on Friday 31 July — a high-impact event that could materially shift the directional picture.
For copper, the balance between existing momentum and scheduled risk events sets the stage for the week ahead.
This analysis covers one dimension. Our full weekly report combines six specialist agents into a single actionable briefing with directional bias, key levels, and risk-opportunity matrix.
Start Free — Get the Market of the WeekFree weekly report · No credit card · Upgrade anytime



