Copper Forecast This Week — Outlook, Drivers & Key Levels
This week's Copper outlook: key drivers, volatility context, risk-opportunity assessment and the week ahead.

Current Market Picture
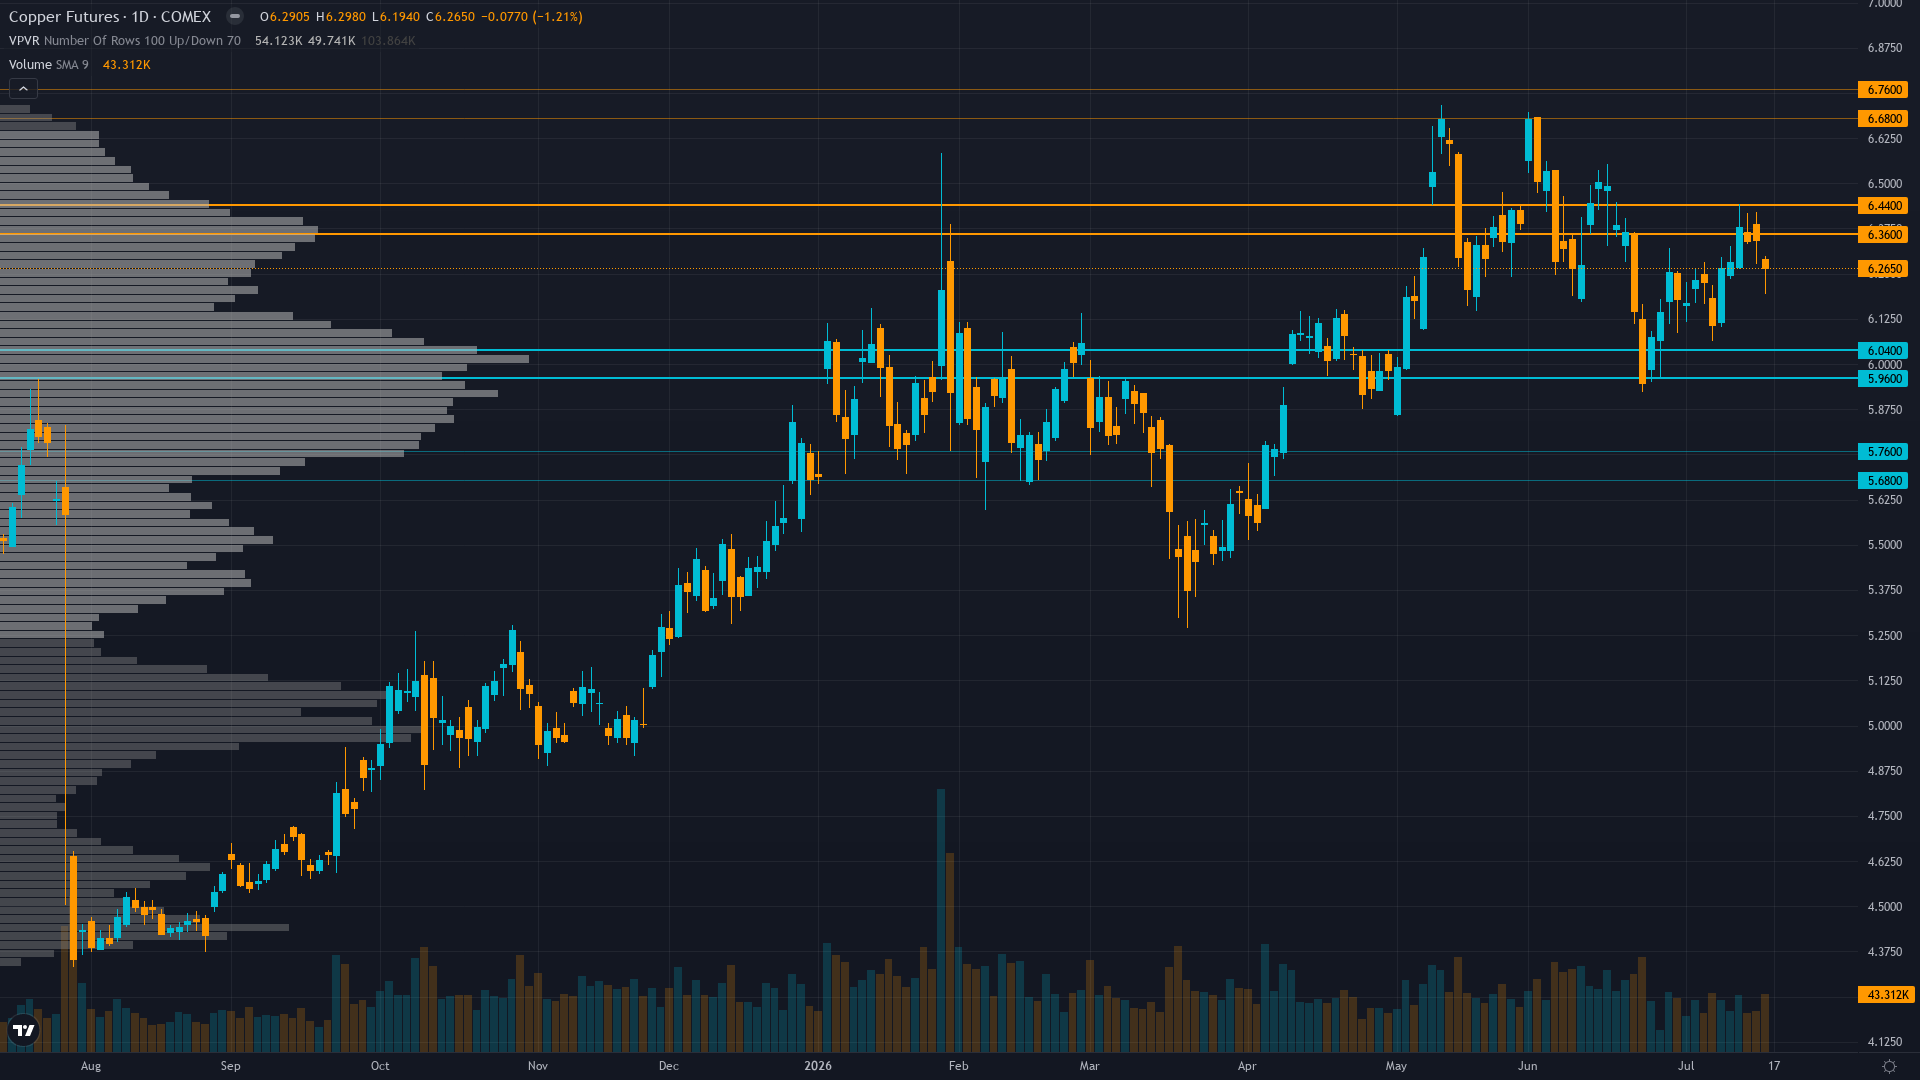
copper fell to 6.27 on a 1.13% decline, with selling pressure dominating price action. The market in copper futures is coiling, with narrowing price ranges suggesting stored energy that will eventually release.
Copper consolidating from January 2026 record highs with elevated prices expected but near-term uncertainty from conflicting ICSG forecast revisions (April 2026 surplus vs October 2025 deficit) creating analytical paralysis despite fresh July 14 inventory decline evidence
Key Drivers This Week
Primary driver: LME inventories declined 18 consecutive sessions through July 14 to 303,525 tonnes with on-warrant stocks at lowest since February (89,725t), representing fresh physical tightness evidence from 5 days ago that validates structural supply deficit narrative despite conflicting ICSG forecast revisions
Secondary factor: Last three graded calls all CORRECT (July 17 NO CALL, July 10 BULLISH, July 3 NO CALL) resetting miss streak to zero and providing analytical credibility to resume directional assessment, while ICSG forecast confusion between April 2026 surplus projection and October 2025 deficit creates fundamental analytical tension
Additional influence: Four of six disciplines signal BULLISH or mildly BULLISH (Fundamental +2.5/7.5, Sentiment +0.5/4, Institutional +0.5/5, Options 0/3) versus two BEARISH (Technical -0.5/4, Economic -0.5/6), creating 67% directional agreement weighted toward top-weighted Fundamental and Economic disciplines showing modest optimism
Economic backdrop: Fed on hold at 3.50-3.75% range with July 28-29 FOMC 95% priced for no change per Polymarket, China Manufacturing PMI mixed at 51.8 (May RatingDog) versus 50.0 (June NBS) showing manufacturing expansion deceleration, VIX 15.03-15.67 below 20 threshold confirming RISK-ON conditions with benign macro regime
Fundamental assessment: Structural supply deficit narrative intact with 18-consecutive-session LME inventory decline through July 14 and on-warrant stocks at lowest since February validating physical tightness, though ICSG forecast confusion (April 2026 surplus vs October 2025 deficit) and current $6.27/lb trading 19% above Goldman $5.21/lb fair value creates analytical uncertainty
Price Structure
Daily trend corrective at $6.27 within downtrend from $6.72 January high, trading below failed $6.30-6.40 resistance zone with RSI likely neutral 48-55 range, 52-week range $4.33-$6.72 placing current at 81st percentile leaving 7% upside to January highs versus 4% downside to $6.08 immediate support
Trend strength at 5/10 paints a picture of a market with some direction but lacking strong conviction.
Upside & Downside
Primary risk: China July PMI (released around July 31, 12 days out) disappointing below 50 expansion threshold confirming June NBS 50.0 reading represents structural demand deterioration validating ICSG April 2026 surplus forecast over October 2025 deficit projection, triggering extended profit-taking from current +12% year-over-year price levels as market reprices from scarcity premium to oversupply discount (Probability: medium)
Primary opportunity: Fresh physical tightness evidence from 18-consecutive-session LME inventory decline through July 14 with on-warrant stocks at lowest since February validates structural deficit thesis over ICSG surplus forecast, driving breakout through $6.37 resistance toward January $6.72 highs as July 28-31 dual catalyst window (FOMC + China PMI) potentially triggers directional resolution favoring supply scarcity narrative (Timeframe: 2-4 weeks as July 28-29 FOMC and July 31 China PMI create binary catalyst windows with 18-consecutive-session inventory decline representing fresh weekly evidence supporting bullish supply deficit case over conflicting fundamental forecast narratives)
This week's edge: Market may be overweighting ICSG forecast confusion and technical breakdown from $6.72 January highs while underweighting that 18-consecutive-session LME inventory decline through July 14 with on-warrant stocks at lowest since February (89,725t) represents FRESH physical evidence from 5 days ago validating structural deficit thesis over conflicting forecast models, creating moderate divergence from prevailing consolidation caution as July 28-31 dual catalysts approach
Volatility Context
At the 62th percentile, copper price volatility sits in a normal range, neither compressed enough to signal a breakout nor elevated enough to demand caution. Realised vol is holding its current level, suggesting the market has found a temporary equilibrium in its risk pricing.
Current 28.5% short-term volatility suggests daily ranges of 2-3% versus normal 1.5-2% for copper, July consolidation showing controlled price action despite ICSG forecast confusion and 18-consecutive-session inventory decline indicating market hesitant to commit directionally ahead of July 28-31 catalyst window, flat term structure plus moderate institutional positioning creates balanced setup where catalysts likely trigger 4-6% move resolving current $6.00-6.40 range compression
Seasonal Patterns
The seasonal picture for COMEX copper turns negative in July 2026 (45% win rate). Summer demand slowdown begins.
Looking Forward
All eyes turn to FOMC statement release July 29 following July 28-29 meeting currently priced at 95% no change but Chair Warsh policy guidance could shift dollar trajectory, with China July PMI release expected around July 31 representing critical demand validation for world's 50% copper consumer on Wednesday 29 July, which carries enough weight to force a decisive directional move.
The week ahead for copper price hinges on whether the prevailing consolidating regime can absorb the scheduled catalysts without a regime shift.
This analysis covers one dimension. Our full weekly report combines six specialist agents into a single actionable briefing with directional bias, key levels, and risk-opportunity matrix.
Start Free — Get the Market of the WeekFree weekly report · No credit card · Upgrade anytime



