Copper Forecast This Week — Outlook, Drivers & Key Levels
This week's Copper outlook: key drivers, volatility context, risk-opportunity assessment and the week ahead.

Market Overview
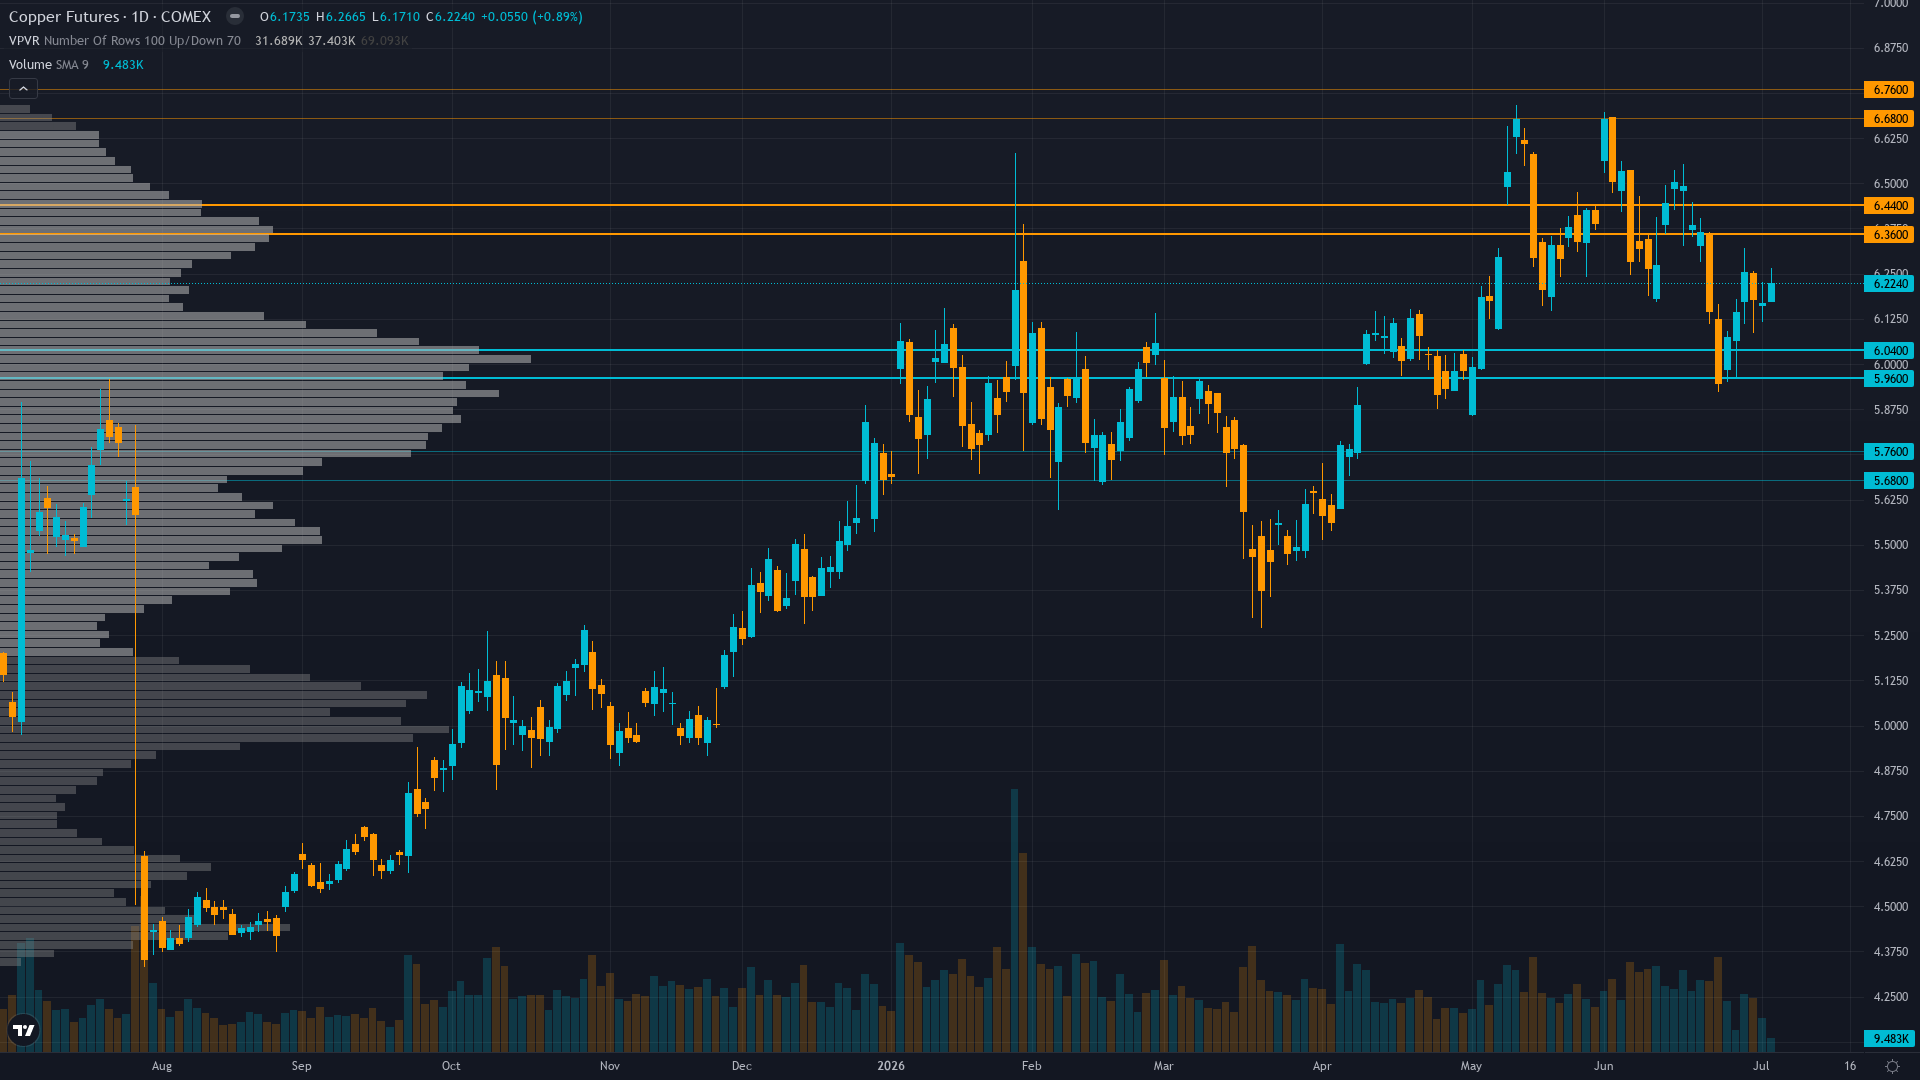
Trading at 6.22 with a 0.89% uptick, copper is drifting higher without strong conviction. copper futures is range-bound and tightening, with decreasing volatility signalling a directional resolution ahead.
Copper consolidating from January 2026 record highs with elevated prices expected to persist supported by structural supply deficit fundamentals but near-term volatility likely as market balances Grasberg supply shock and sulfuric acid export ban against China demand tepid signals with PMI barely expansionary at 50.3
This Week's Catalysts & Drivers
Primary driver: Structural supply deficit from Grasberg mine offline through Q2 2026 and China sulfuric acid export ban affecting 15% of global mining remains intact, while June 30 China Manufacturing PMI at 50.3 (released June 30, 6 days ago) validates manufacturing expansion floor providing demand support despite mixed signals
Secondary factor: Last week's NO CALL graded CORRECT with price gaining +1.37%, resetting consecutive miss streak to zero and removing Miss Reset Rule constraint, creating analytical flexibility to resume directional assessment after mandatory 2-week reset period from prior 4-miss sequence
Additional influence: Technical recovery from June breakdown lows at $6.14 to current $6.22 represents modest 1.3% bounce but price remains 7.3% below January $6.72 all-time high, trading at 81st percentile of 52-week range with VIX at 16 confirming RISK-ON macro regime supportive of cyclical commodities
Economic backdrop: Fed on hold at 3.65% interest rate paid on reserve balances per June 16-17 FOMC meeting (18 days ago) with 90% market pricing for no change at July 28-29 meeting, China Manufacturing PMI at 50.3 (June 30 release) barely expansionary with high-tech equipment PMI at 53.5 providing AI/tech-driven demand support, VIX 16 below 20 threshold confirming RISK-ON regime
Fundamental assessment: Structural supply deficit materializing with LME inventory at 361,600 tonnes (June 15, now 20 days old) and available stock critically tight while Grasberg offline through Q2 2026 removing 525k-600k tons creates scarcity premium, current $6.22/lb (~$13,710/mt) trading above Goldman $10,710/mt H1 target but modestly undervalued per Fundamental agent +3.5/7 citing ICSG 150,000-tonne deficit versus prior surplus forecasts
Technical Picture
Daily trend consolidating sideways at $6.22 above 50-day MA zone (~$5.85-5.90) with RSI likely neutral 46-55 range showing momentum recovery from June oversold readings but lacking directional conviction, 52-week range $4.33-$6.72 placing current at 81st percentile leaving 8% upside to January highs versus 3.5% downside to $6.00 psychological support
At 5/10, trend strength is middling — enough to suggest a lean, but not enough to trade with high confidence.
Bull & Bear Case
Primary risk: China July PMI (released around July 31, 26 days out) disappointing below 50 expansion threshold confirming June 50.3 reading was peak not sustained recovery, validating that high-tech manufacturing strength at 53.5 has not translated to broader copper-intensive sectors and triggering profit-taking from elevated +23% year-over-year price levels as demand destruction narrative gains credibility (Probability: medium)
Primary opportunity: Structural supply deficit from Grasberg offline persistence through Q2 2026 and China sulfuric acid export ban affecting 15% global mining combines with June high-tech equipment PMI surge to 53.5 (significantly outpacing broader 50.3) validating AI infrastructure/data center demand themes, driving breakout through $6.40 resistance toward January $6.72 highs as market reprices scarcity premium and deficit reality over 2-4 week horizon (Timeframe: 2-4 weeks as late July FOMC and end-July China PMI create dual catalyst windows, with July-August seasonal construction activity in Northern Hemisphere providing additional demand support if China validates expansion resilience above 50 threshold)
This week's edge: Market may be overweighting June consolidation duration and China PMI weakness at 50.3 as demand destruction signals while underweighting that high-tech equipment PMI at 53.5 (significantly outpacing broader manufacturing) represents AI/data center demand validation not yet fully priced, available LME inventory excluding warrants critically tight contradicting headline 361,600t stock levels, and Grasberg supply shock persisting through Q2 2026 creating asymmetric upside setup toward $6.40-6.72 resistance as late July dual catalysts potentially trigger breakout
Volatility Regime
Volatility for copper price is at the 65th percentile over 90 days — a normal regime that allows for standard position sizing and conventional trade management. The vol trend is flat, with no meaningful shift across timeframes. Stable vol environments often lull traders before a regime change arrives.
Current 28.5% short-term volatility (5-day) suggests daily ranges of 2-3% versus normal 1.5-2%, consolidation showing controlled price action rather than blow-off top characteristics with stable volatility ranges since late June indicating digestion phase nearing completion ahead of late July catalyst events, supply-driven rallies historically more sustainable than monetary-driven moves creating confidence in trend continuation potential
What History Shows
COMEX copper faces seasonal pressure in July 2026 — historical patterns show a 45% win rate to the downside. Summer demand slowdown begins.
The Week Ahead
FOMC meeting July 28-29 with statement release expected July 29 currently priced at 90% no change but Chair Powell press conference could shift forward guidance, while China July PMI release expected around July 31 representing critical demand validation for world's 50% copper consumer after June 50.3 tepid reading on Wednesday 29 July is a high-impact catalyst with the potential to redefine the near-term outlook entirely.
How copper futures navigates the confluence of consolidating conditions and incoming data will determine whether the current directional thesis holds or breaks.
This analysis covers one dimension. Our full weekly report combines six specialist agents into a single actionable briefing with directional bias, key levels, and risk-opportunity matrix.
Start Free — Get the Market of the WeekFree weekly report · No credit card · Upgrade anytime



