Copper COT & Institutional Positioning — Smart Money Analysis
Copper institutional positioning: COT data, sentiment analysis and smart money flow assessment.

Where Institutions Stand
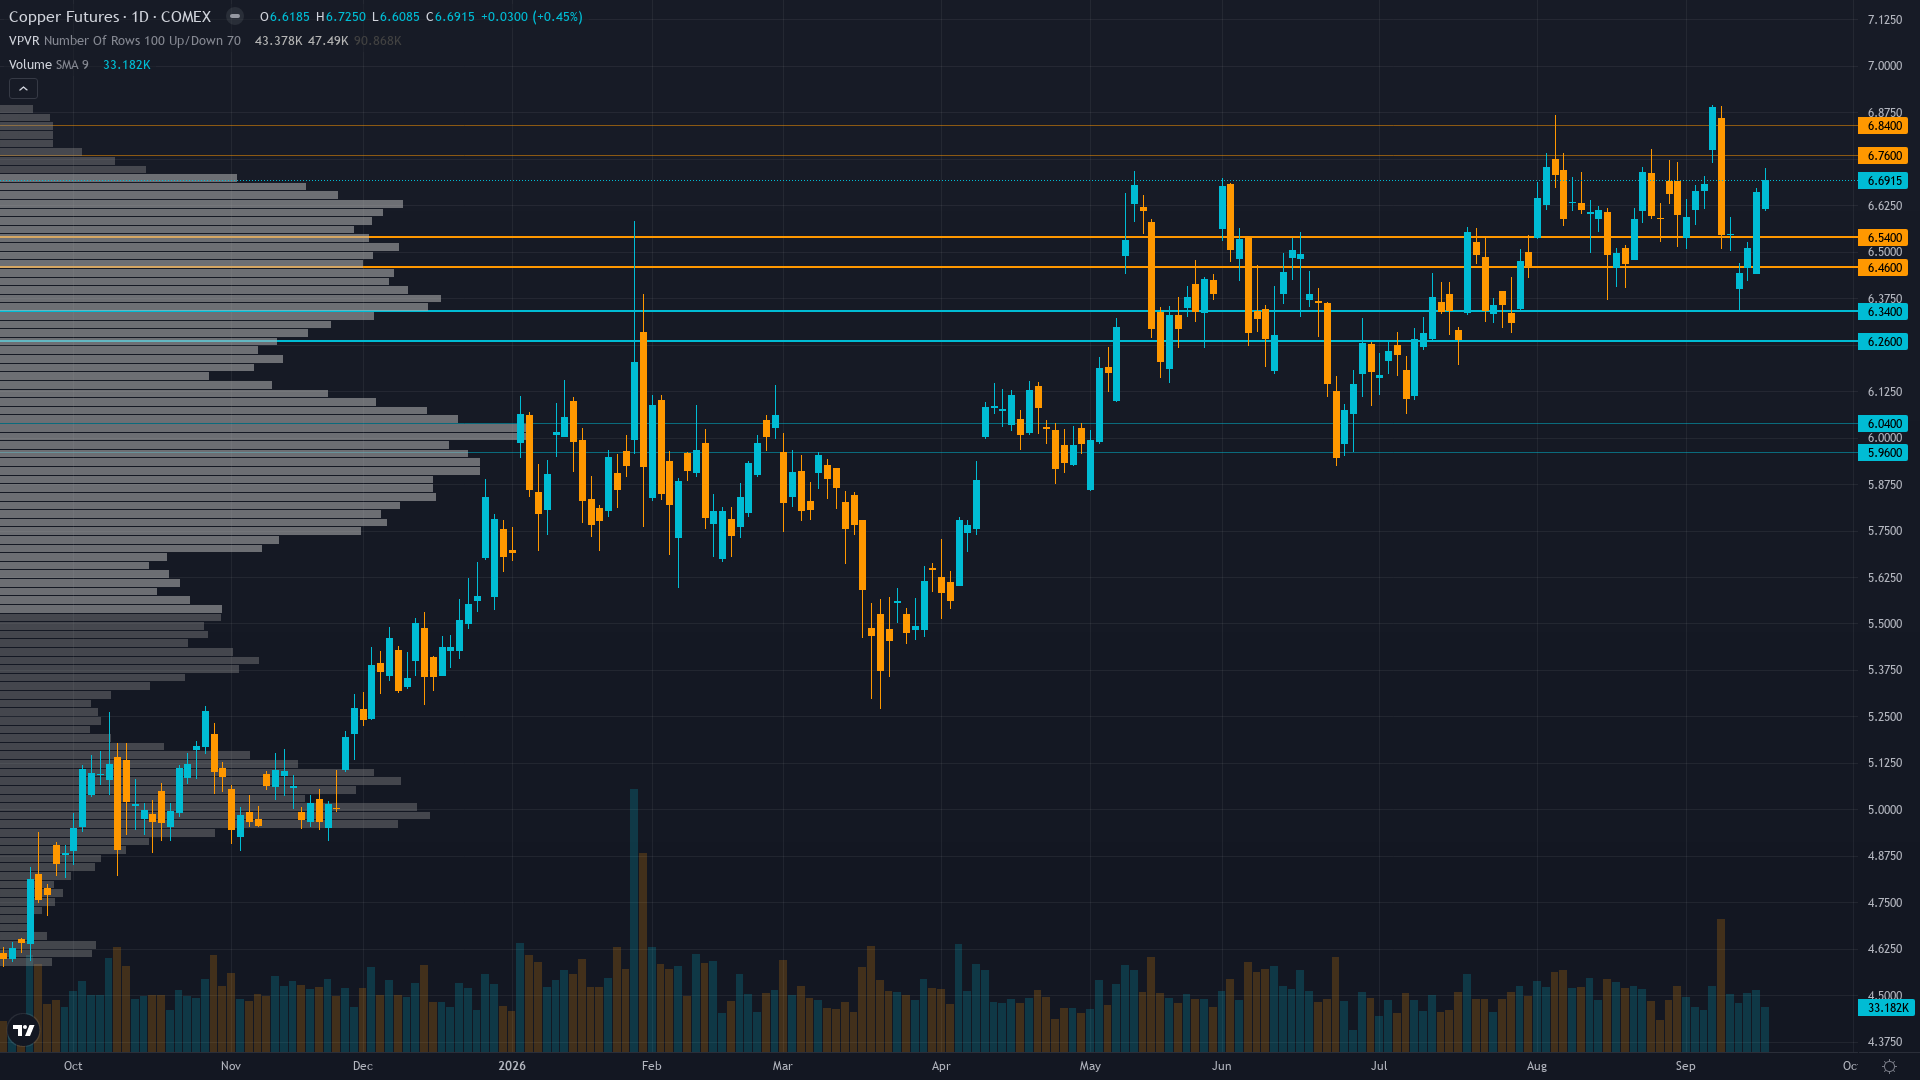
At 6.615, copper has inched 0.43% higher in a measured advance.
Non-commercial net long at 75,134 contracts (93rd percentile, 26% of OI) with -17,342 WoW reduction from all-time high of 92,476 — healthy de-risking from extreme crowding while maintaining strong structural bullish conviction; LME warehouse stocks rose to 255,900 tonnes with market shifting from backwardation to contango ($67.50/t discount) suggesting easing physical urgency
Consensus vs MAD View
Market consensus: Copper trading near all-time nominal highs supported by structural supply deficit and El Niño production disruptions, but consolidating after the Fed's 25bp rate hike and tariff uncertainty with COT de-risking from extreme levels and LME stocks rising modestly
Primary driver: Structural supply deficit confirmed by El Niño-driven simultaneous production disruptions across South America (flooding in Chile/Peru mines) and Africa (drought reducing hydroelectric power) in September 2026, with ING forecasting 600,000-tonne deficit for 2026 and Codelco withdrawing its production target on Aug 13
Where the Crowd May Be Wrong
Mild divergence: the desk sees the fresh September 2026 El Niño dual-region production disruption (flooding in Americas, drought in Africa) as an underweighted supply shock catalyst that post-dates the reported COT and inventory data, while the market is focused on near-term physical easing (rising LME stocks to 255,900t, contango structure) and digesting the Fed rate hike, creating a modest gap between the desk's assessment of structural scarcity premium and the consensus focus on positional/metric headwinds
Crowd Psychology
Neither side has committed heavily to copper futures, leaving sentiment in a neutral zone that offers little directional guidance on its own.
Options Flow
Limited current data but as of Aug 3 HGU6 ATM IV at 28.7% vs 20-day RV of 21.5% showing +7.2 vol point variance risk premium, put/call volume ratio of 0.43 indicating call bias, elevated IV reflecting supply uncertainty premium consistent with structural deficit narrative
The Bottom Line on Positioning
The positioning mosaic for HG futures combines neutral sentiment with stable volatility conditions. Trend strength registers at 7/10, suggesting meaningful but not extreme directional bias. Taken together, institutional behaviour, crowd psychology, and derivatives data frame the setup heading into the new week.
This analysis covers one dimension. Our full weekly report combines six specialist agents into a single actionable briefing with directional bias, key levels, and risk-opportunity matrix.
Start Free — Get the Market of the WeekFree weekly report · No credit card · Upgrade anytime



