Copper COT & Institutional Positioning — Smart Money Analysis
Copper institutional positioning: COT data, sentiment analysis and smart money flow assessment.

Where Institutions Stand
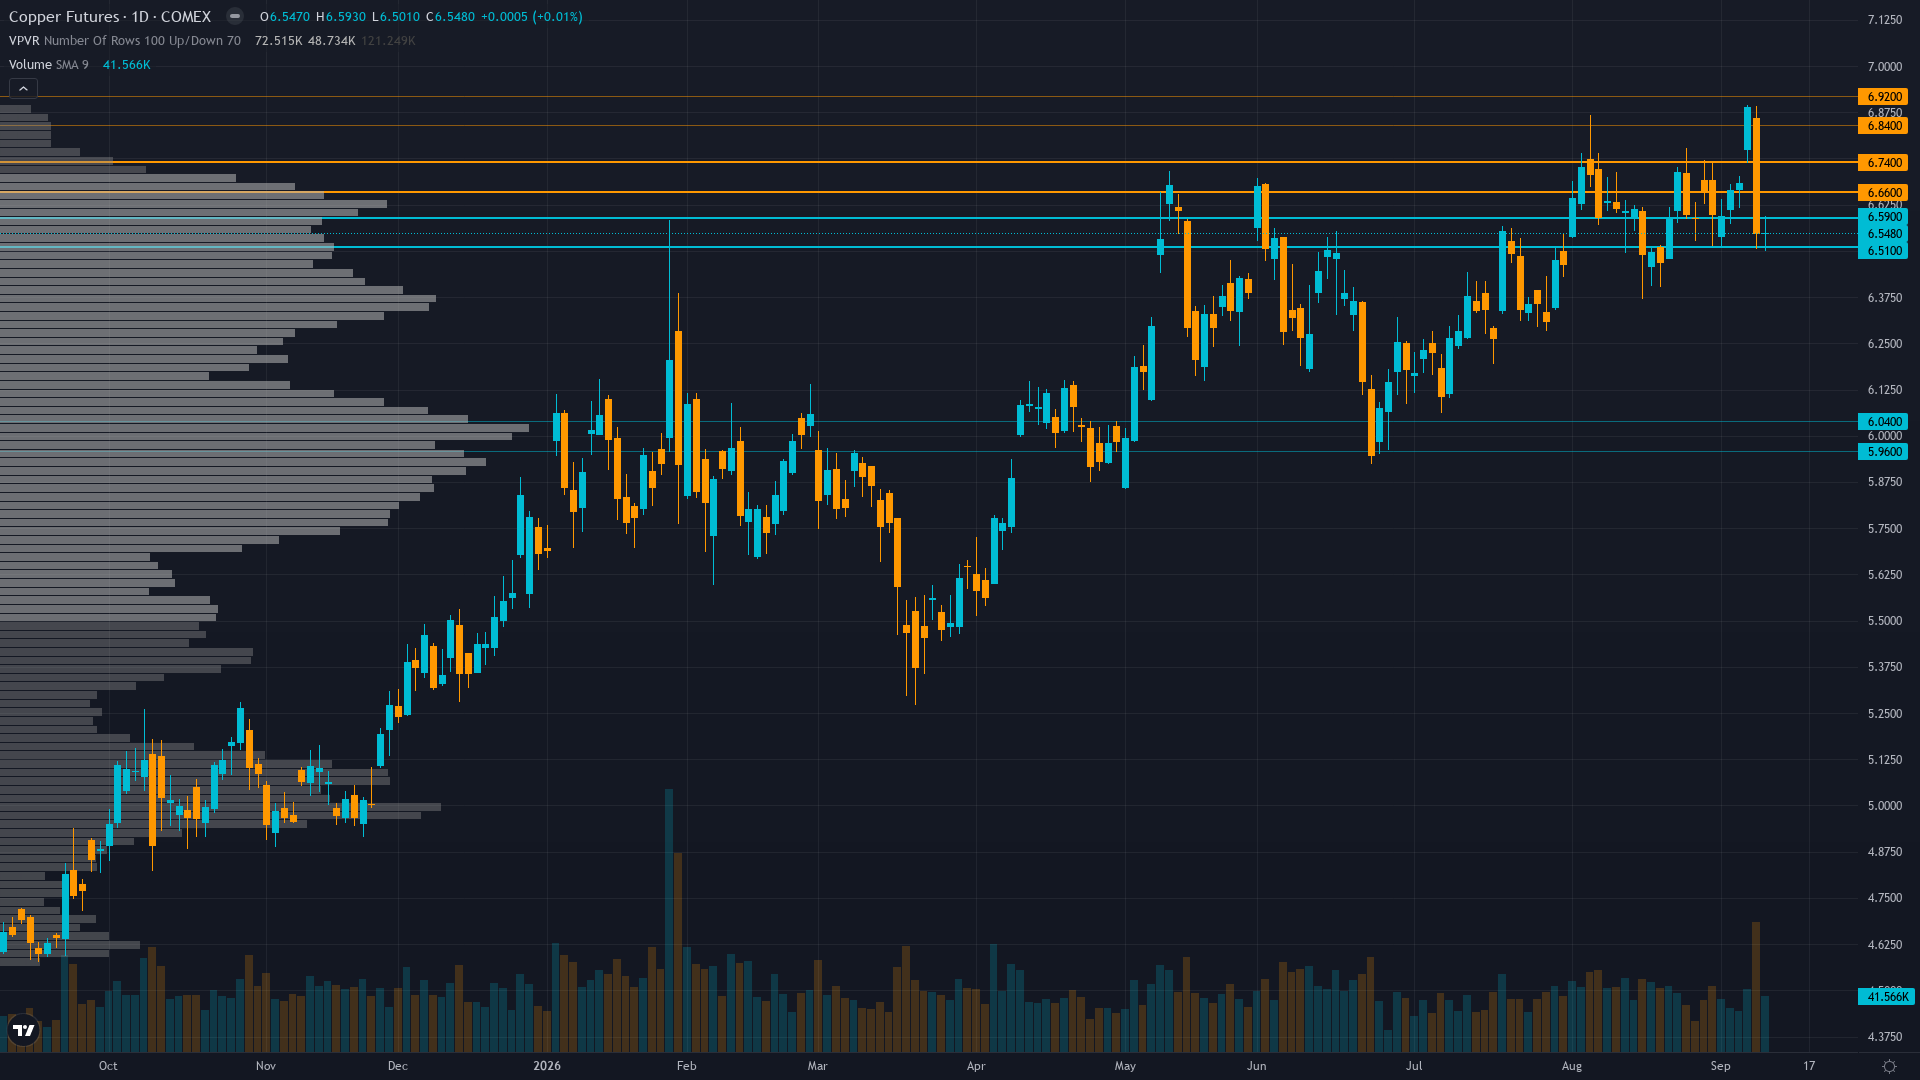
copper holds at 6.4695, up a marginal 0.04% as the market grinds forward.
Non-commercial net long at 92,476 contracts (99.4th percentile 3-year, ALL-TIME HIGH per CFTC Sep 8) with +11,607 WoW increase, representing the most extreme speculative bullish crowding in the dataset's 158-week history, commercial hedgers net short -104,644 contracts creating classic divergence
Consensus vs MAD View
Market consensus: Copper consolidating near record highs supported by US tariff expansion fears driving supply squeeze premium and structural deficit fundamentals, but extreme COT positioning at 99.4th percentile all-time high and imminent China data/FOMC catalyst cluster creating acute binary event risk for the week ahead
Primary driver: US copper tariff fears driving LME to all-time high above $14,600/tonne on Sep 7 (Bloomberg) with market anticipating expanded Trump tariffs on refined copper imports, creating acute supply squeeze narrative that overrides near-term demand weakness concerns
Where the Crowd May Be Wrong
Desk's cautiously bullish lean at conviction 6 diverges mildly from the market's extreme bullish COT positioning (99.4th percentile at 92,476 contracts) and bearish macro headwinds (rising yields, potential Fed hike), identifying the fresh Sep 7-8 Bloomberg tariff catalyst as a structural supply squeeze justification for elevated pricing that the crowd may be misinterpreting as speculative froth rather than justified scarcity premium in a deficit market
Crowd Psychology
Neither side has committed heavily to copper futures, leaving sentiment in a neutral zone that offers little directional guidance on its own.
Options Flow
Limited current data with stale Aug 3 put/call ratio of 0.43 indicating call bias; 20-day realised vol at 24.4% from pre-fetched pack showing elevated but not extreme volatility consistent with consolidation near record highs
The Bottom Line on Positioning
The positioning mosaic for HG futures combines neutral sentiment with contracting volatility conditions. Trend strength sits at 5/10, reflecting moderate directional pressure without clear dominance. Taken together, institutional behaviour, crowd psychology, and derivatives data frame the setup heading into the new week.
This analysis covers one dimension. Our full weekly report combines six specialist agents into a single actionable briefing with directional bias, key levels, and risk-opportunity matrix.
Start Free — Get the Market of the WeekFree weekly report · No credit card · Upgrade anytime



