Copper COT & Institutional Positioning — Smart Money Analysis
Copper institutional positioning: COT data, sentiment analysis and smart money flow assessment.

Where Institutions Stand
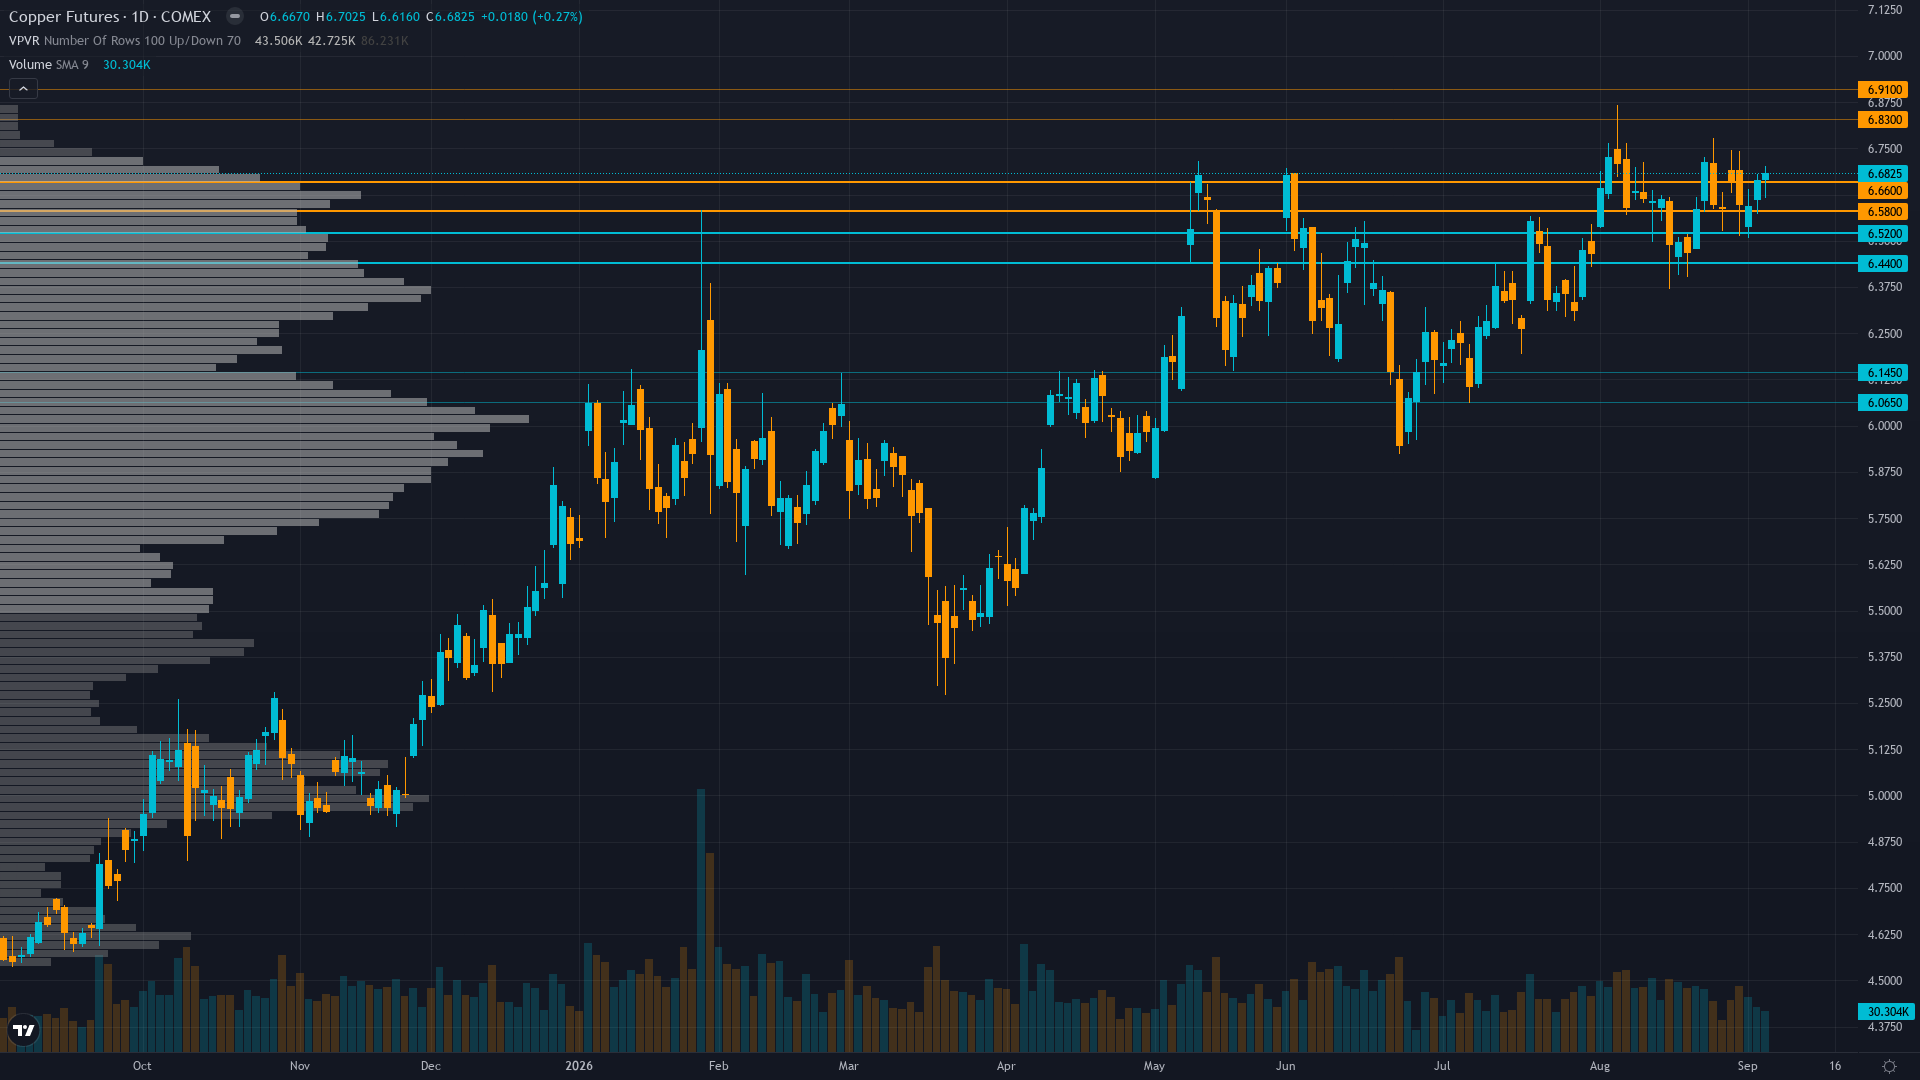
copper sits at 6.597 after a 0.30% gain — a quiet move higher without aggressive momentum.
Non-commercial net long at 80,869 contracts as of Sep 1, 98.7th percentile of 3-year range, declining -4,397 WoW from Aug 25 peak — still extreme but modestly easing, with LME on-warrant stocks continuing to decline toward critical low levels amid 42 straight days of draws
Consensus vs MAD View
Market consensus: Copper consolidating near 52-week highs supported by structural supply deficit and fresh mine disruption narrative but facing headwinds from hawkish Fed repricing and extreme COT positioning as market awaits Sep 8-11 China/US data cluster for demand validation
Primary driver: Fresh supply disruption narrative from Bloomberg September 3, 2026 article on mounting mine setbacks (Grasberg force majeure continuing through 2026, Quebrada Blanca downgrades, global mine supply declining 1.1% in H1) reinforces structural deficit thesis for 2026, with ICSG forecasting 150,000-tonne deficit — the first structural shortage since 2009
Where the Crowd May Be Wrong
Desk's mildly bullish lean aligns with the market's prevailing bullish COT consensus (98.7th percentile) but with meaningfully different magnitude — the desk is cautiously bullish (conviction 6) while the crowd is extremely long (80,869 contracts); the fresh Bloomberg Sep 3 mine setback catalyst and the approaching Sep 8-11 data cluster represent blindspots the market has not yet fully priced against the dominant hawkish Fed narrative, creating mild but not extreme divergence
Crowd Psychology
Neither side has committed heavily to copper futures, leaving sentiment in a neutral zone that offers little directional guidance on its own.
Options Flow
Limited current data but Aug 3 readings showed ATM IV at 28.7% vs 20-day realised vol of 14.5% (pre-fetched pack), creating a 14.2-vol-point positive variance risk premium that reflects substantial supply uncertainty premium built into option prices; put/call volume ratio was 0.43 indicating call bias in flow
The Bottom Line on Positioning
The positioning mosaic for HG futures combines neutral sentiment with contracting volatility conditions. Trend strength registers at 7/10, suggesting meaningful but not extreme directional bias. Taken together, institutional behaviour, crowd psychology, and derivatives data frame the setup heading into the new week.
This analysis covers one dimension. Our full weekly report combines six specialist agents into a single actionable briefing with directional bias, key levels, and risk-opportunity matrix.
Start Free — Get the Market of the WeekFree weekly report · No credit card · Upgrade anytime



