Copper COT & Institutional Positioning — Smart Money Analysis
Copper institutional positioning: COT data, sentiment analysis and smart money flow assessment.

Where Institutions Stand
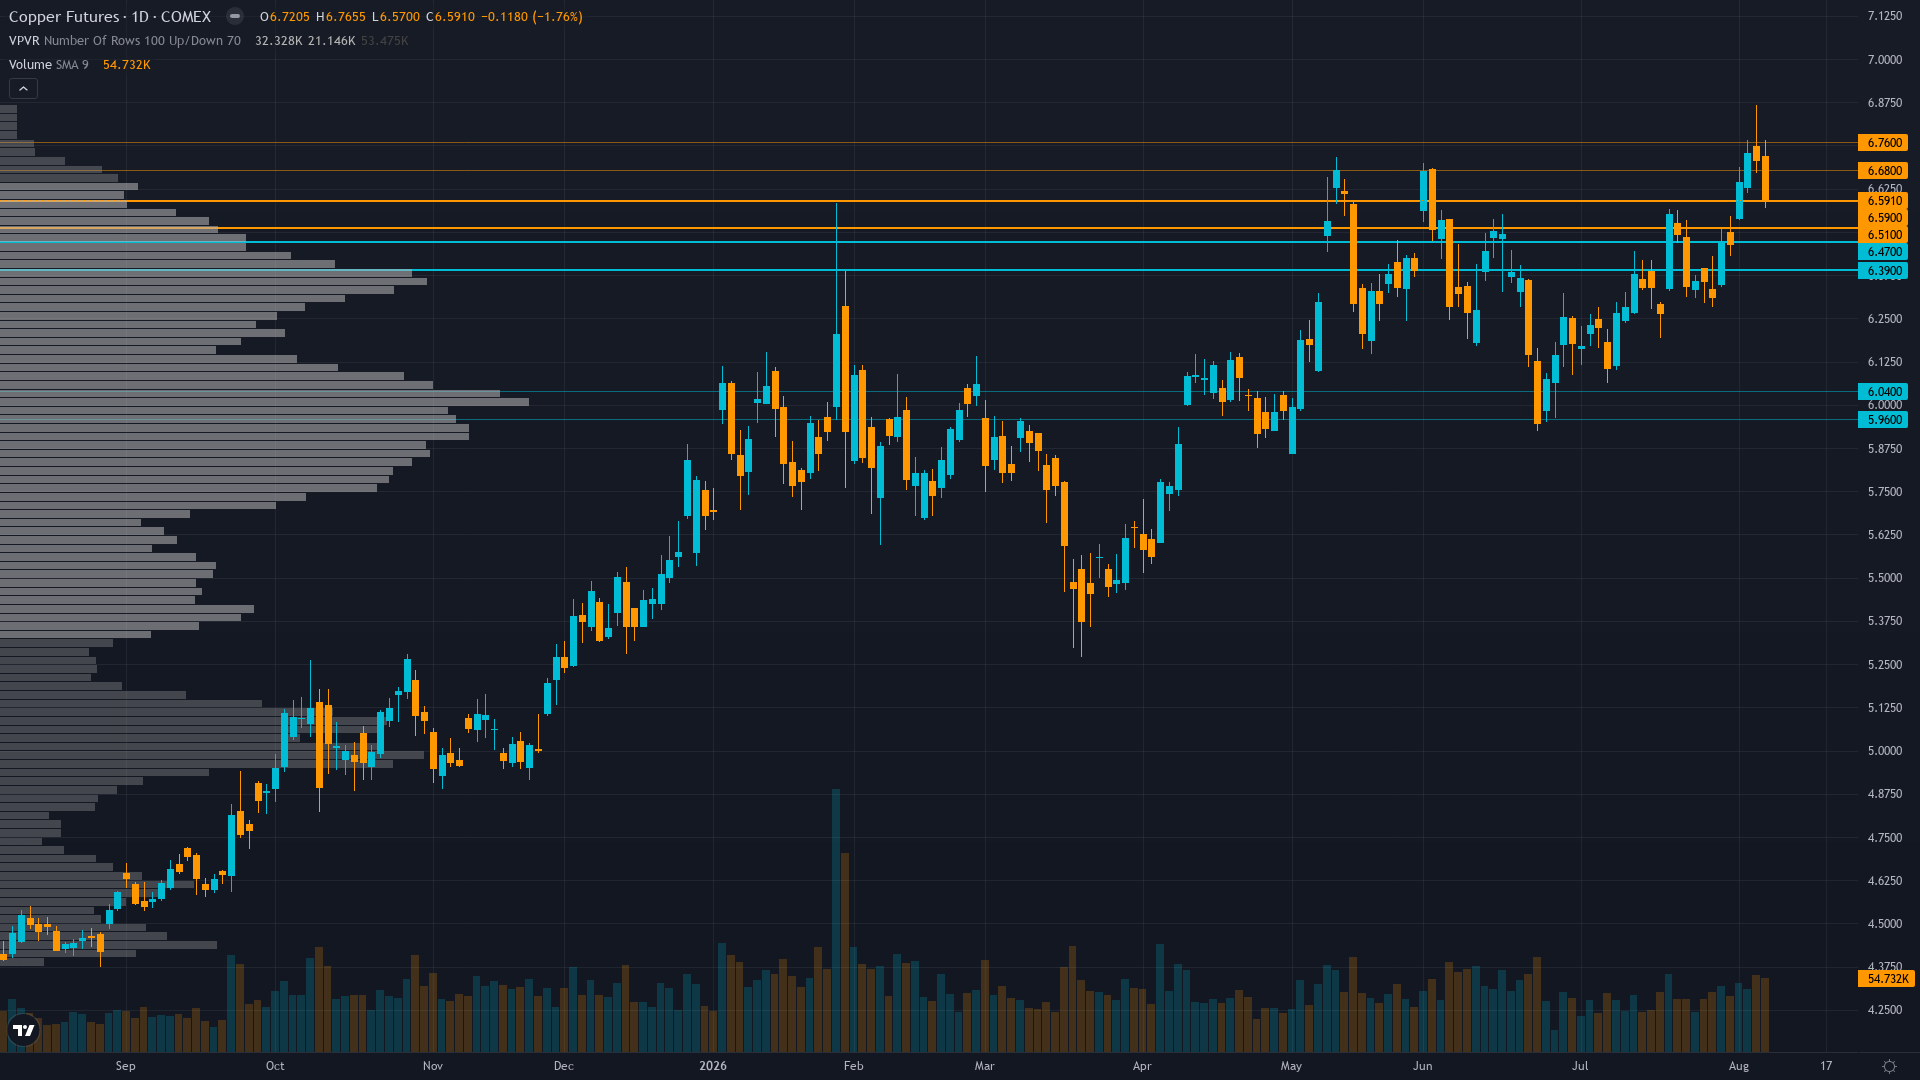
copper fell to 6.57 on a 1.74% decline, with selling pressure dominating price action.
Non-commercial net long at 77,123 contracts as of Aug 4, up 9,842 WoW, at 98.7th percentile of 3-year range representing extreme bullish speculative crowding with significant mean reversion risk if physical scarcity narrative falters, though China state reserve expansion under new mineral law provides structural bid support
Consensus vs MAD View
Market consensus: Copper trading near yearly highs with physical supply tightness (backwardation at $130, LME inventory critically low) supporting bullish structure but concerns about extreme speculative positioning at 98.7th percentile COT and seasonal August headwinds creating tactical uncertainty ahead of Aug 12 US CPI catalyst
Primary driver: LME physical market in acute backwardation with cash/3-month spread widening to $130/ton (most since October 2026) combined with Codelco's El Teniente mine facing potential partial suspension for up to 2 years, validating fresh physical scarcity that overrides seasonal August weakness and extreme COT positioning concerns
Where the Crowd May Be Wrong
Desk identifies LME backwardation at $130/ton (widest since October) and Codelco El Teniente 2-year suspension risk as fresh physical scarcity catalysts the market is underweighting relative to focus on extreme COT positioning at 98.7th percentile, creating moderate divergence where physical evidence supports bullish continuation despite positioning and seasonal headwinds
Crowd Psychology
Neither side has committed heavily to copper futures, leaving sentiment in a neutral zone that offers little directional guidance on its own.
Options Flow
HGU6 September ATM IV at 28.7% (Aug 3) versus 20-day realised vol of 21.5%, representing a positive variance risk premium of 7.2 vol points with put/call volume ratio of 0.43 indicating mild call bias in options flow, elevated IV reflecting supply uncertainty premium
The Bottom Line on Positioning
The positioning mosaic for HG futures combines neutral sentiment with stable volatility conditions. Trend strength registers at 7/10, suggesting meaningful but not extreme directional bias. Taken together, institutional behaviour, crowd psychology, and derivatives data frame the setup heading into the new week.
This analysis covers one dimension. Our full weekly report combines six specialist agents into a single actionable briefing with directional bias, key levels, and risk-opportunity matrix.
Start Free — Get the Market of the WeekFree weekly report · No credit card · Upgrade anytime



