Copper COT & Institutional Positioning — Smart Money Analysis
Copper institutional positioning: COT data, sentiment analysis and smart money flow assessment.

Where Institutions Stand
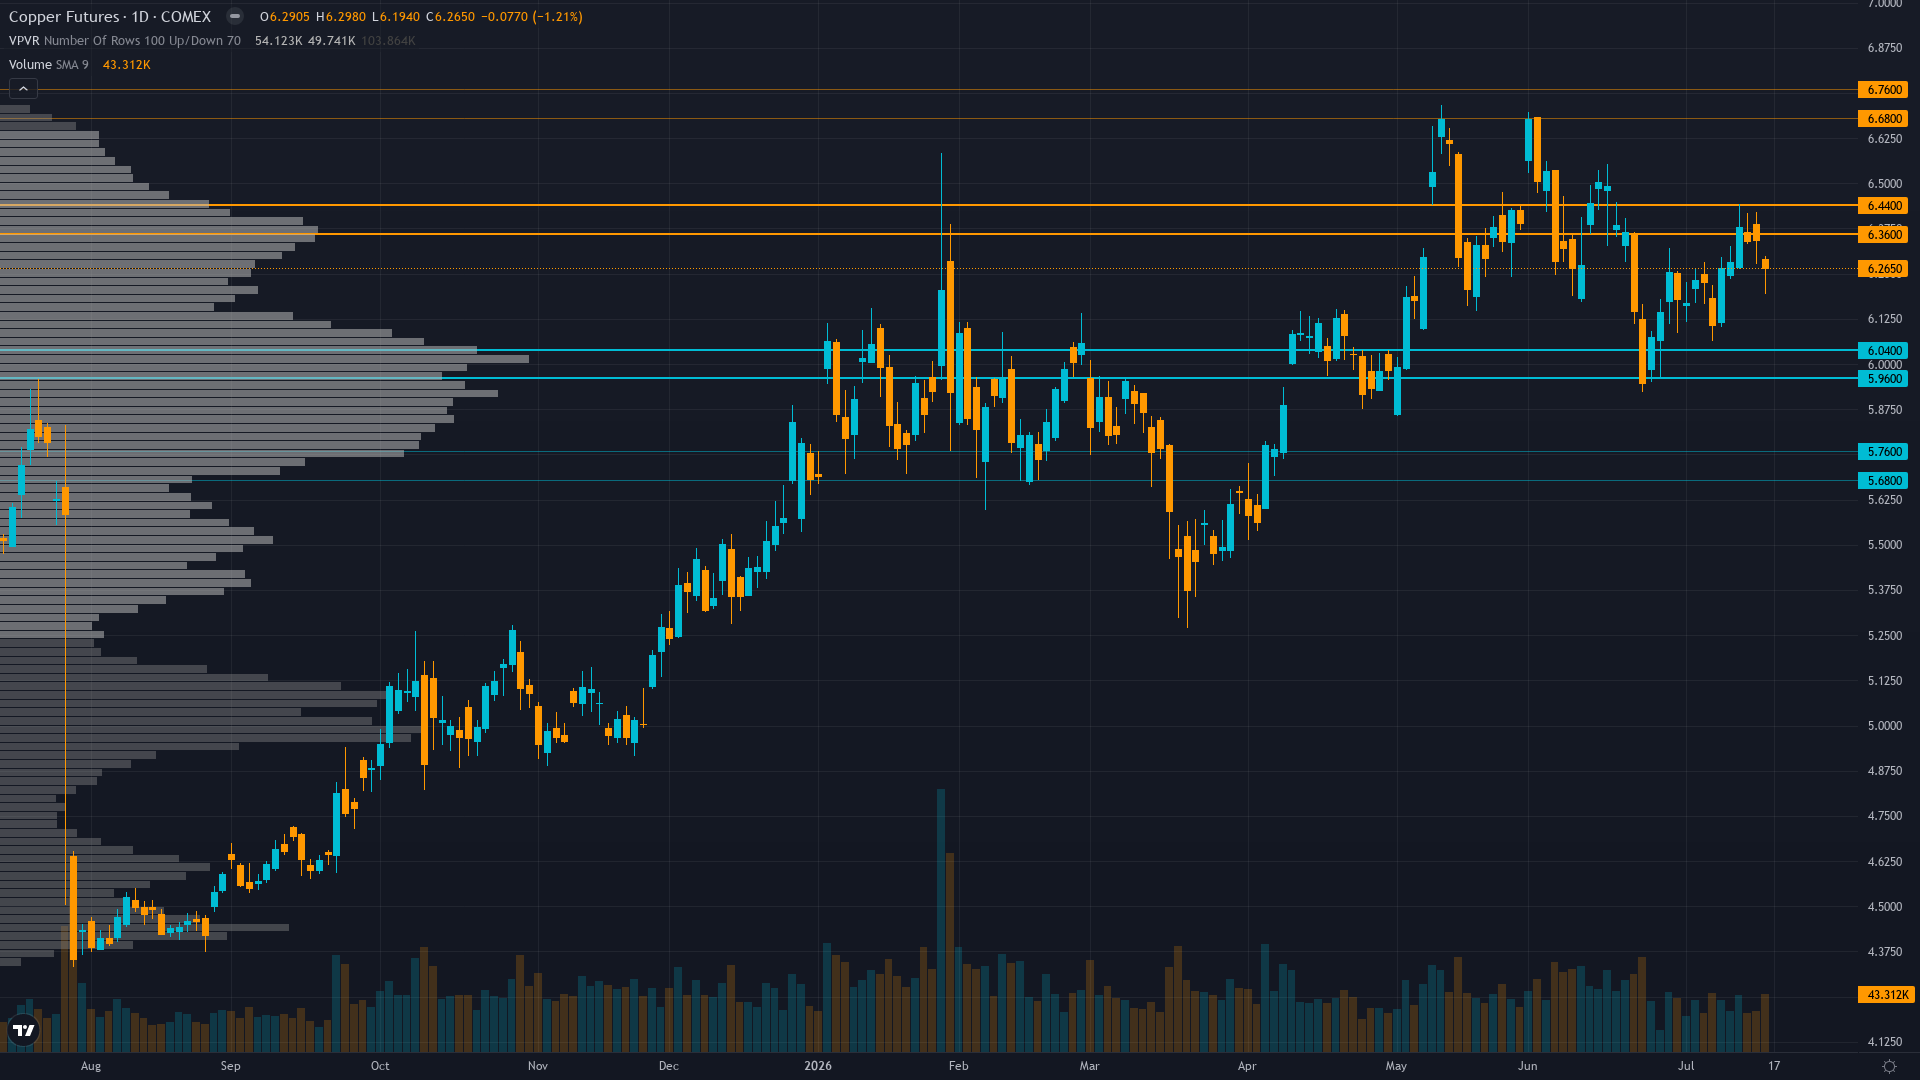
Trading at 6.27 after a 1.13% slide, copper faces sustained selling interest.
Managed money net long at approximately 72,000 contracts (mid-July CFTC) represents moderate 45th-55th percentile positioning in neutral zone showing neither crowding extreme nor capitulation, while China state reserve expansion provides structural bid support offsetting speculative positioning concerns
Consensus vs MAD View
Market consensus: Copper consolidating from January 2026 record highs with elevated prices expected but near-term uncertainty from conflicting ICSG forecast revisions (April 2026 surplus vs October 2025 deficit) creating analytical paralysis despite fresh July 14 inventory decline evidence
Primary driver: LME inventories declined 18 consecutive sessions through July 14 to 303,525 tonnes with on-warrant stocks at lowest since February (89,725t), representing fresh physical tightness evidence from 5 days ago that validates structural supply deficit narrative despite conflicting ICSG forecast revisions
Where the Crowd May Be Wrong
Desk identifies 18-consecutive-session LME inventory decline through July 14 (fresh 5-day-old physical evidence) as underweighted catalyst validating structural deficit over ICSG forecast confusion, while market consensus focused on consolidation uncertainty and conflicting fundamental narratives, creating moderate divergence from prevailing range-bound caution with conviction at 6 suggesting meaningful but not extreme contrarian position as July 28-31 catalysts approach
Crowd Psychology
Neither side has committed heavily to copper futures, leaving sentiment in a neutral zone that offers little directional guidance on its own.
Options Flow
Insufficient current options data with implied volatility last reported around 28-33% moderately elevated but no fresh directional skew or positioning data available, limiting options confirmation of directional thesis
The Bottom Line on Positioning
The positioning mosaic for HG futures combines neutral sentiment with stable volatility conditions. Trend strength sits at 5/10, reflecting moderate directional pressure without clear dominance. Taken together, institutional behaviour, crowd psychology, and derivatives data frame the setup heading into the new week.
This analysis covers one dimension. Our full weekly report combines six specialist agents into a single actionable briefing with directional bias, key levels, and risk-opportunity matrix.
Start Free — Get the Market of the WeekFree weekly report · No credit card · Upgrade anytime



