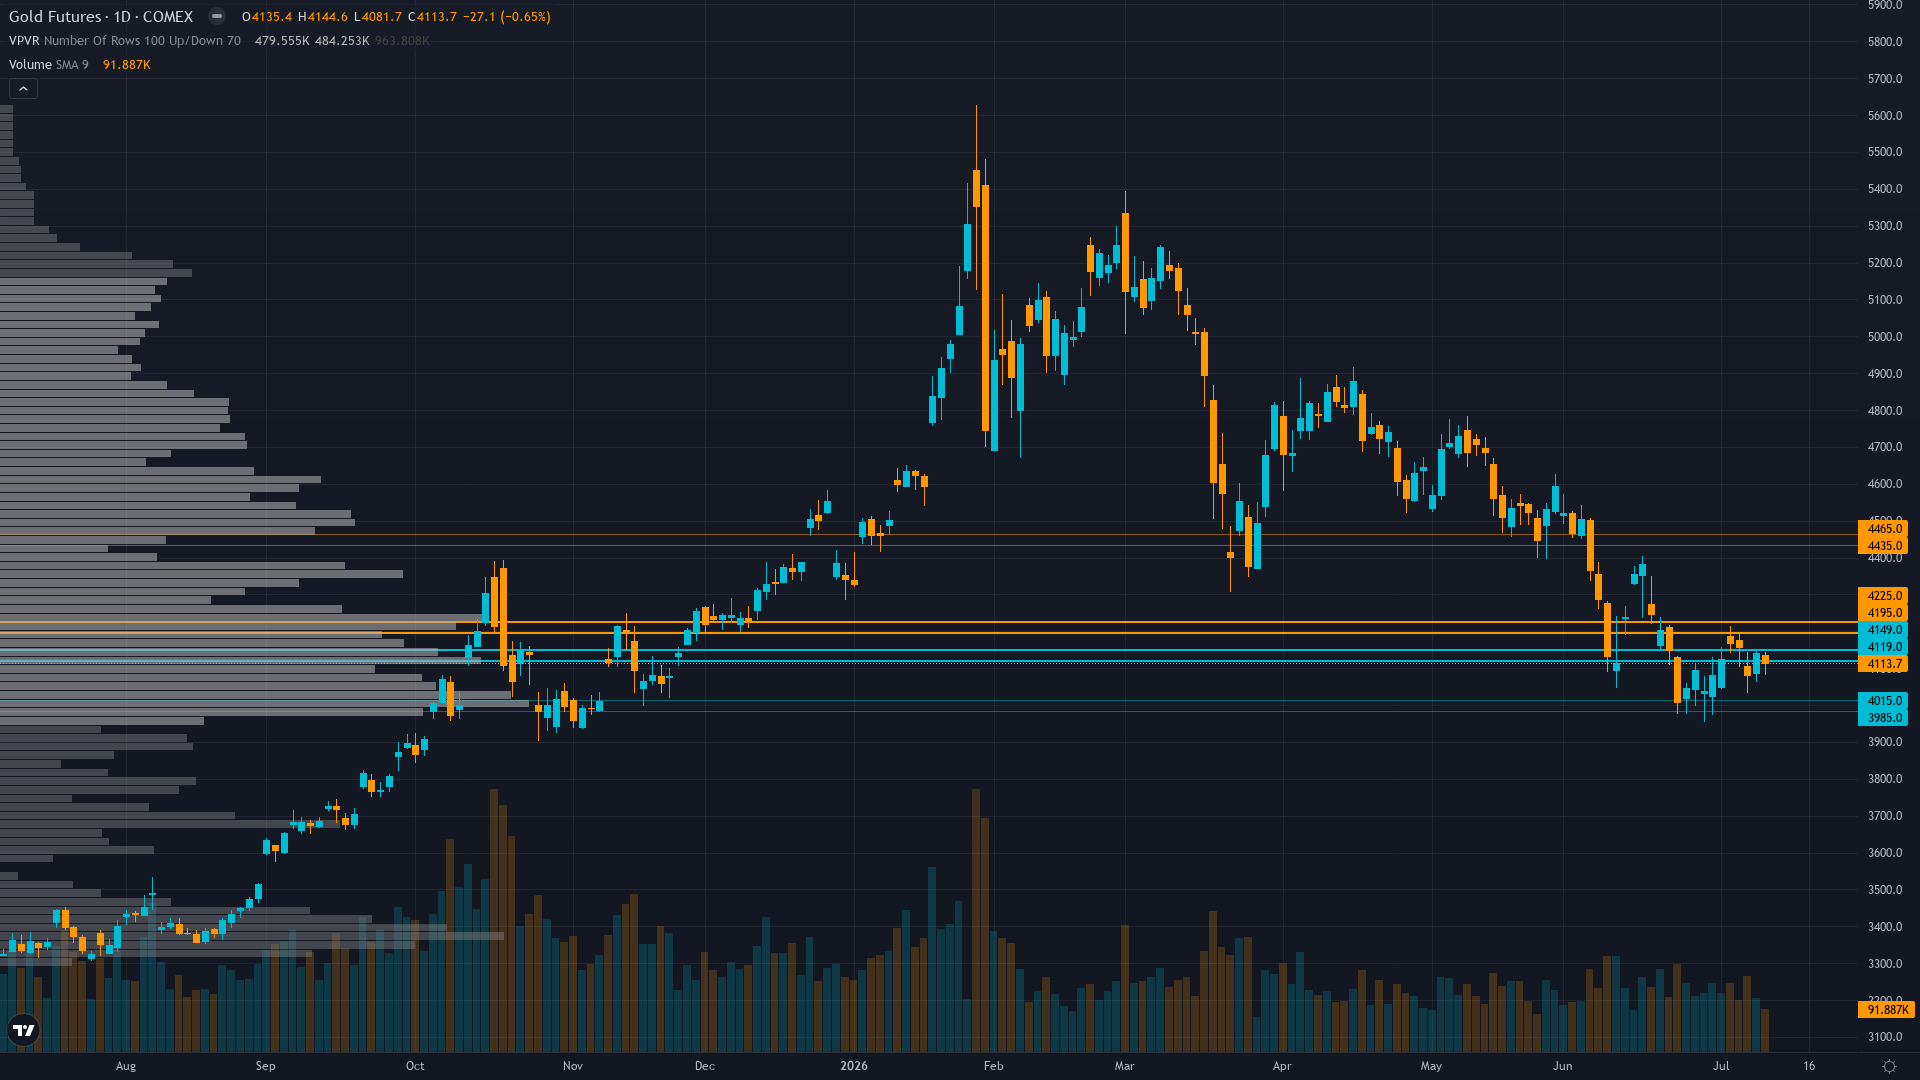
Gold Forecast This Week — Outlook, Drivers & Key Levels
This week's Gold outlook: key drivers, volatility context, risk-opportunity assessment and the week ahead.
This week's Gold outlook: key drivers, volatility context, risk-opportunity assessment and the week ahead.
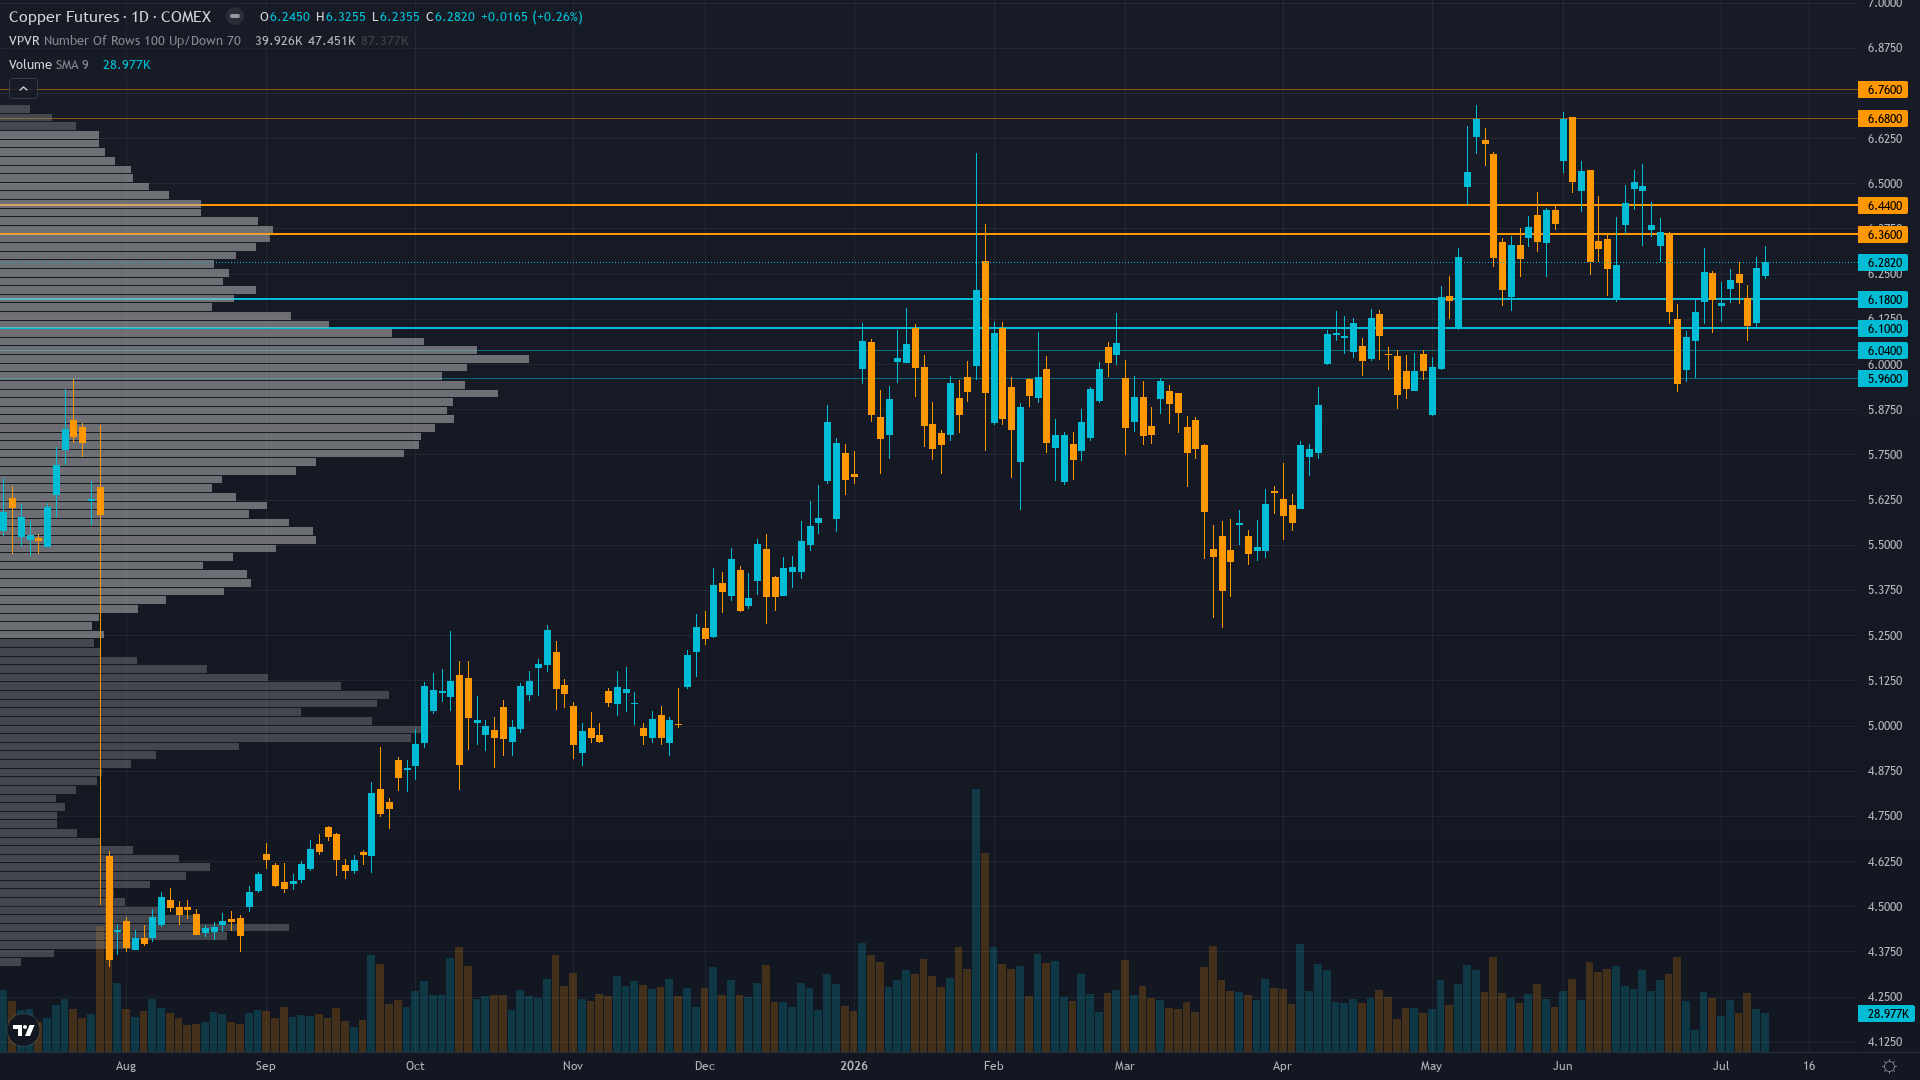
Copper key levels breakdown: support zones, resistance zones, confluence and price structure.
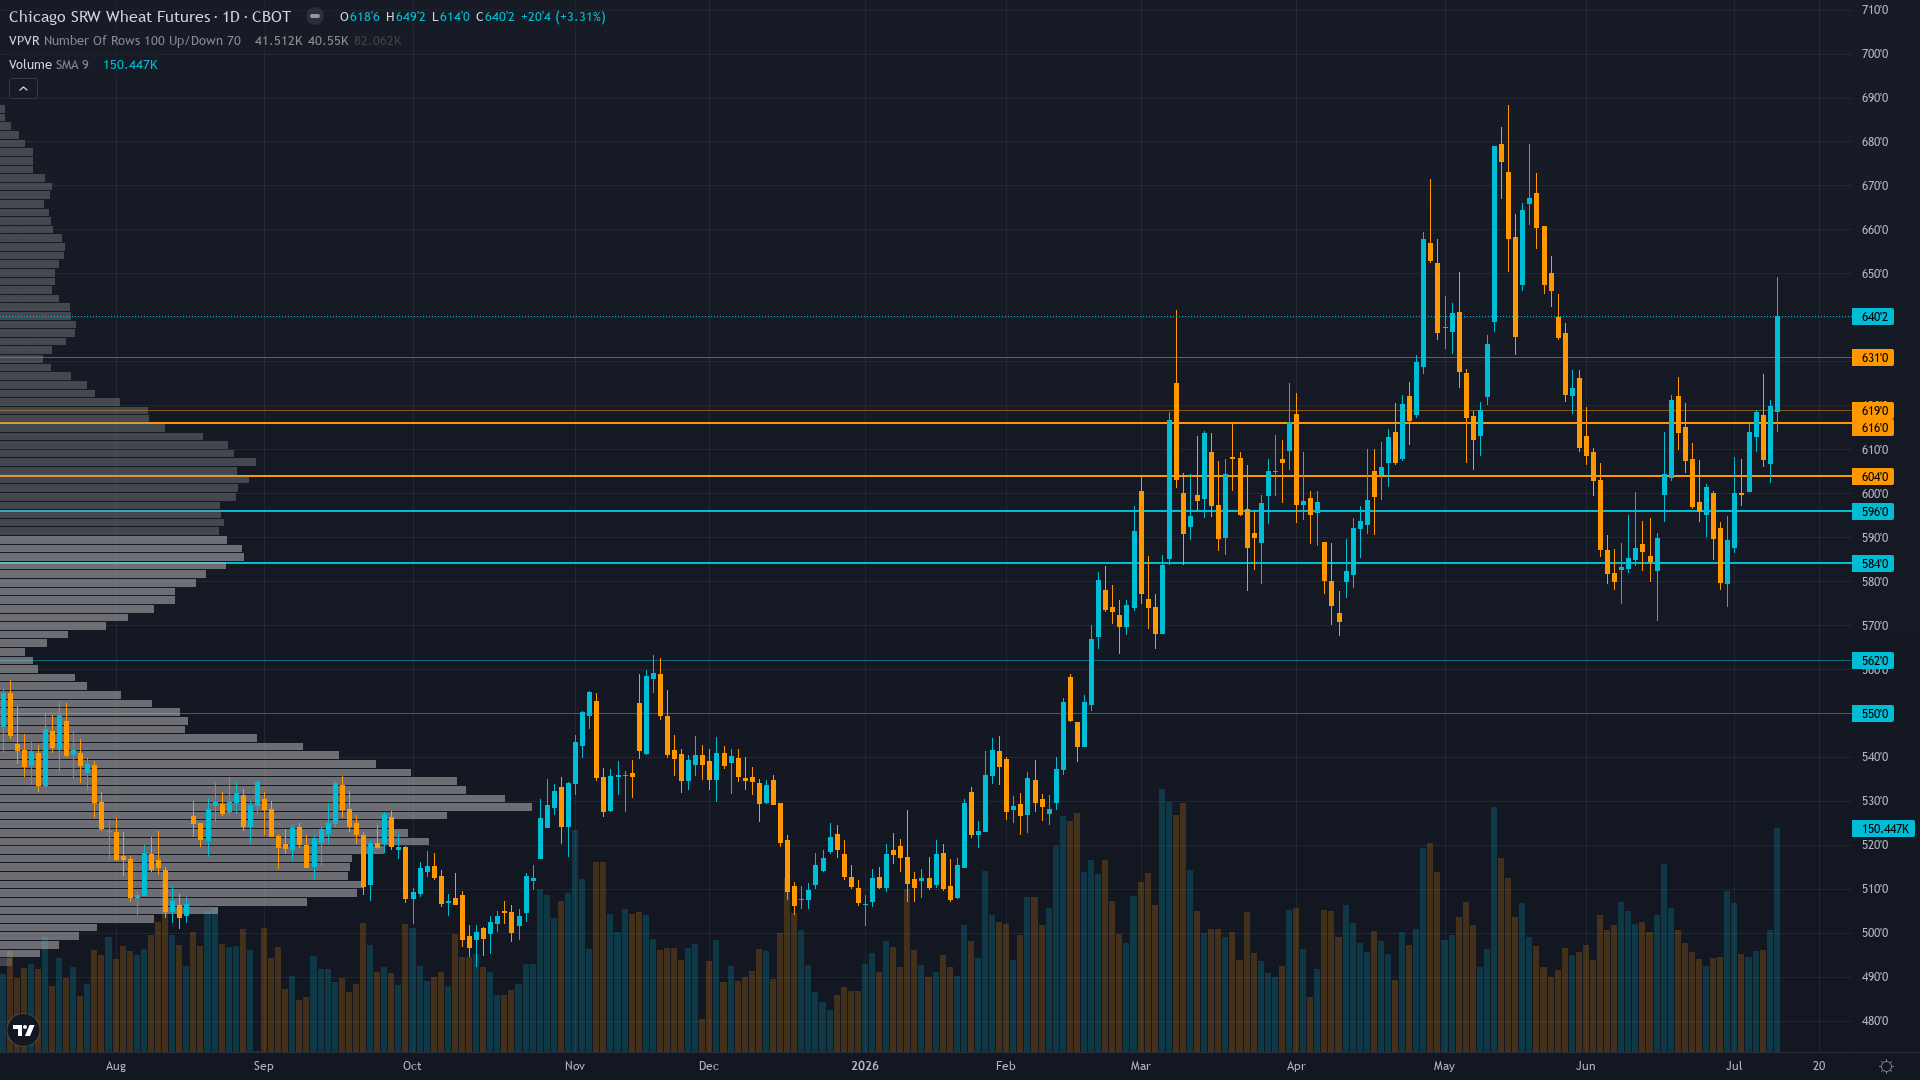
Wheat (ZW):
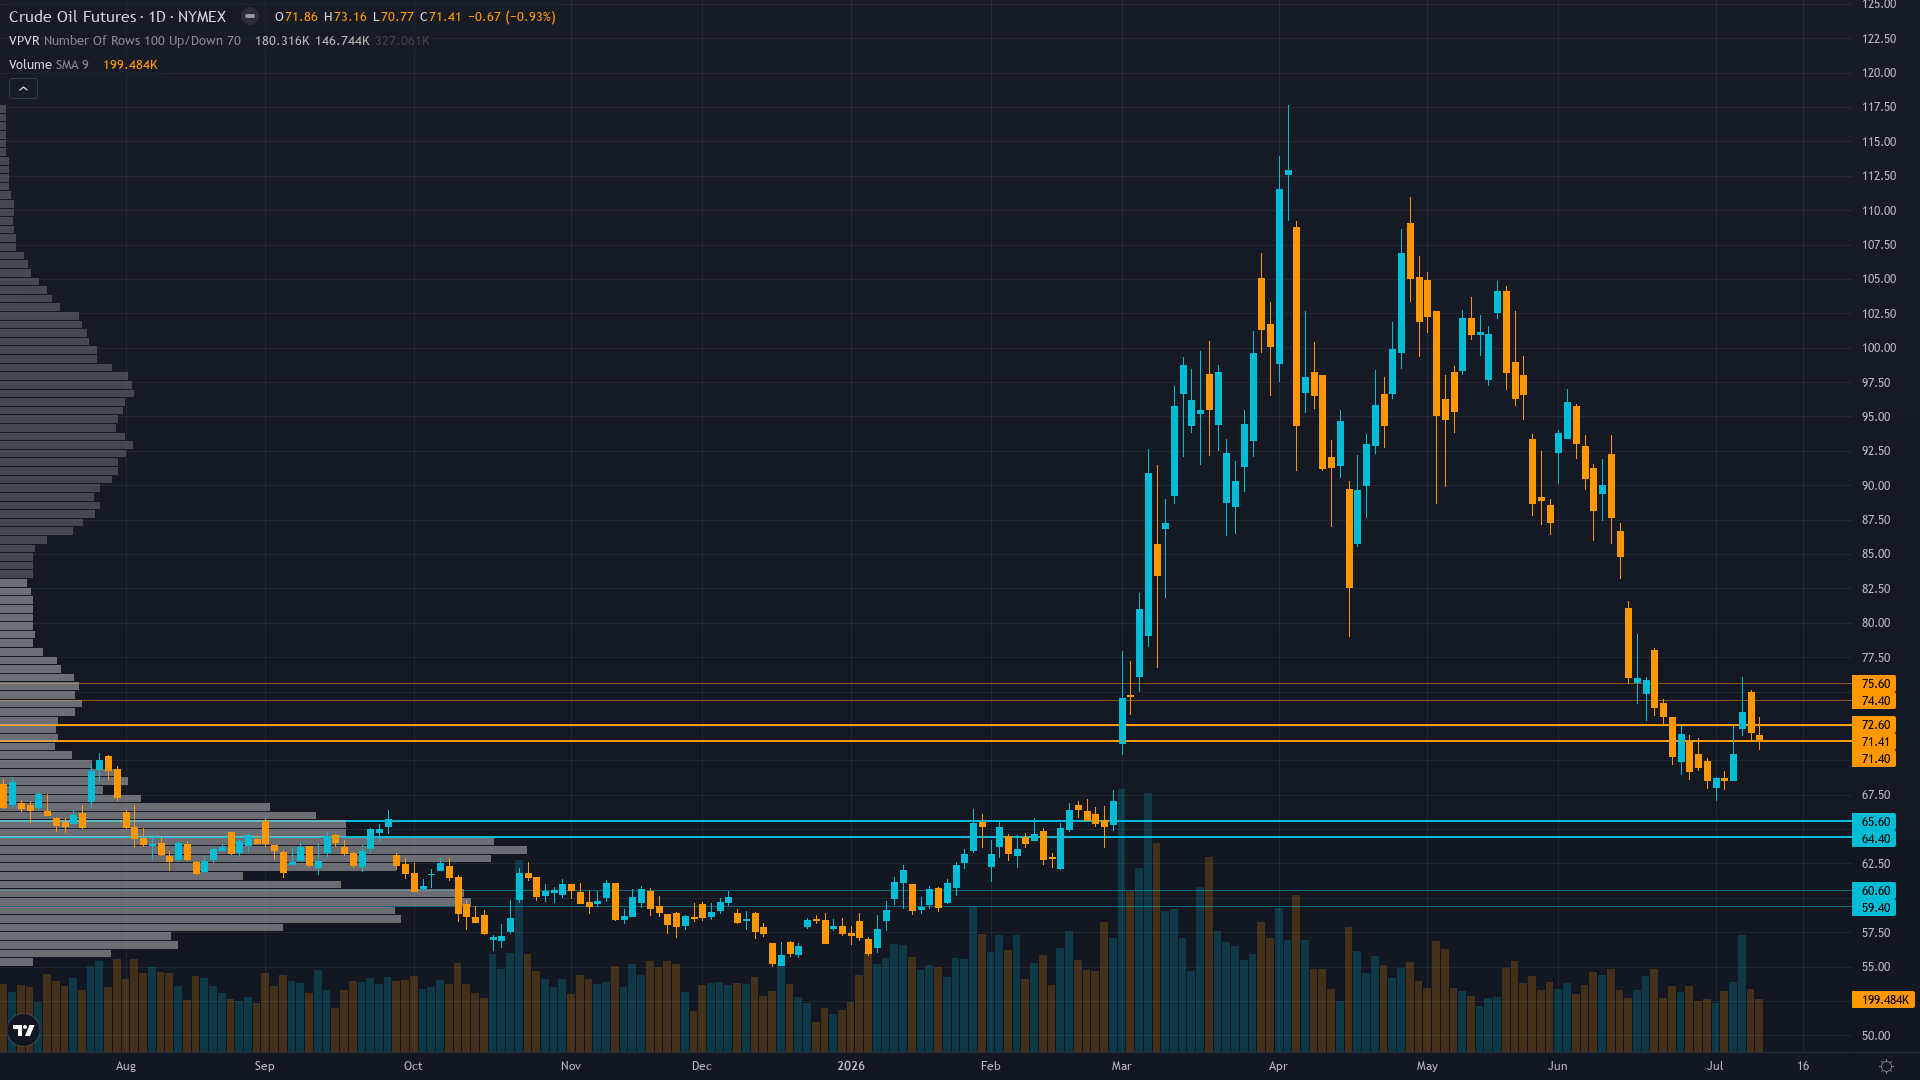
Core
Tactically uncertain with market having completed mean reversion as current $71.41 WTI at pre-war February levels MINUS $2 per IEA July 10 report; structural oversupply consensus (IEA 4.7 mb/d surplus, EIA -1.2 mb/d demand decline) validates bearish fundamental picture yet current pricing suggests f
Core
Deeply divided with institutional year-end targets ranging from $4,900 (Goldman Sachs revised lower) to $6,300 (JPMorgan) maintaining structural bull case but near-term positioning increasingly bearish following July 1 Treasury yield shock, June ETF outflows $5.3B, and 27% correction from January pe
Extended
Copper consolidating from January 2026 record highs with elevated prices under pressure from ICSG's July 1 forecast reversal to surplus outlook for 2026-2027, market balancing structural supply constraints (Grasberg offline, sulfuric acid export ban) against demand uncertainty from China tepid PMI e
Extended
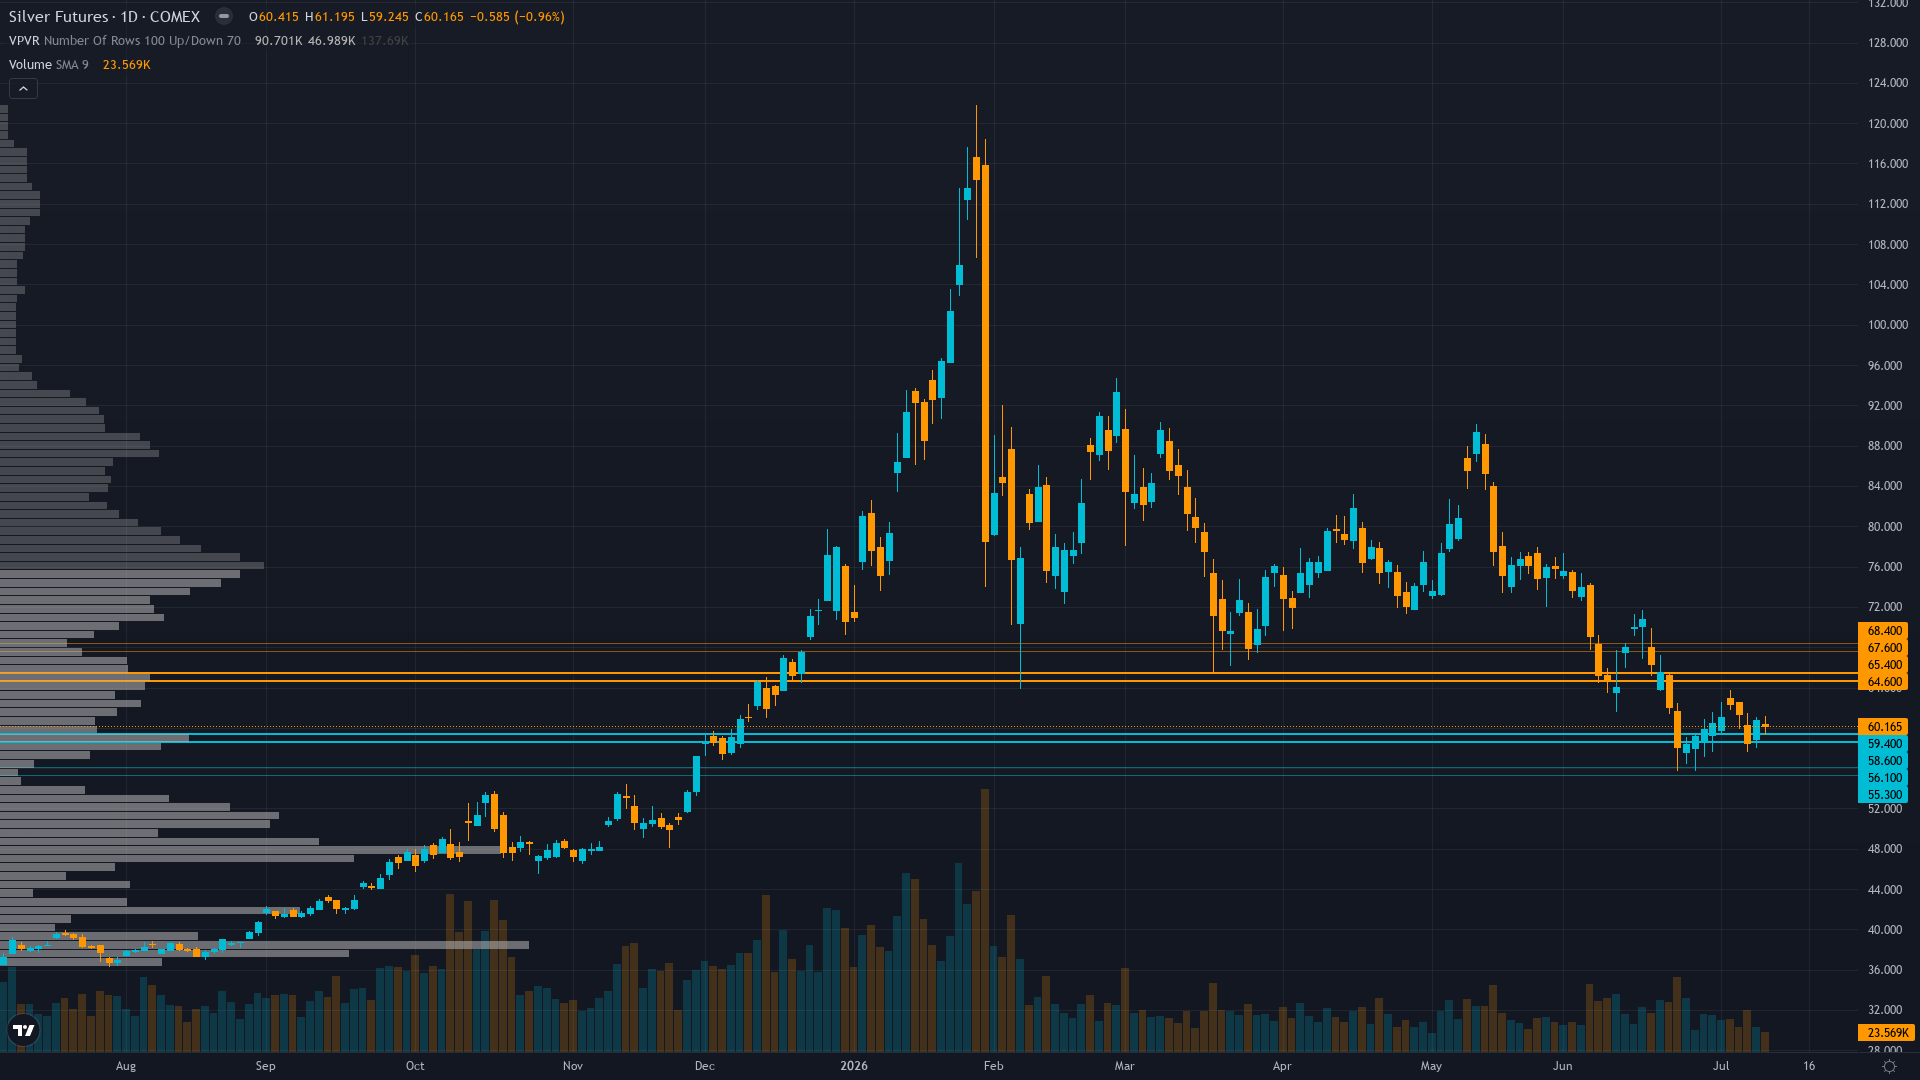
Market consensus fractured between structural deficit bulls targeting $68-75 recovery on intact sixth-year deficit fundamentals per Silver Institute July 6 update and cautious bears projecting $55-58 test if July 14 CPI hot, with CoinCodex algorithm predicting -4.31% to $57.26 by July 17 suggesting
Full Desk
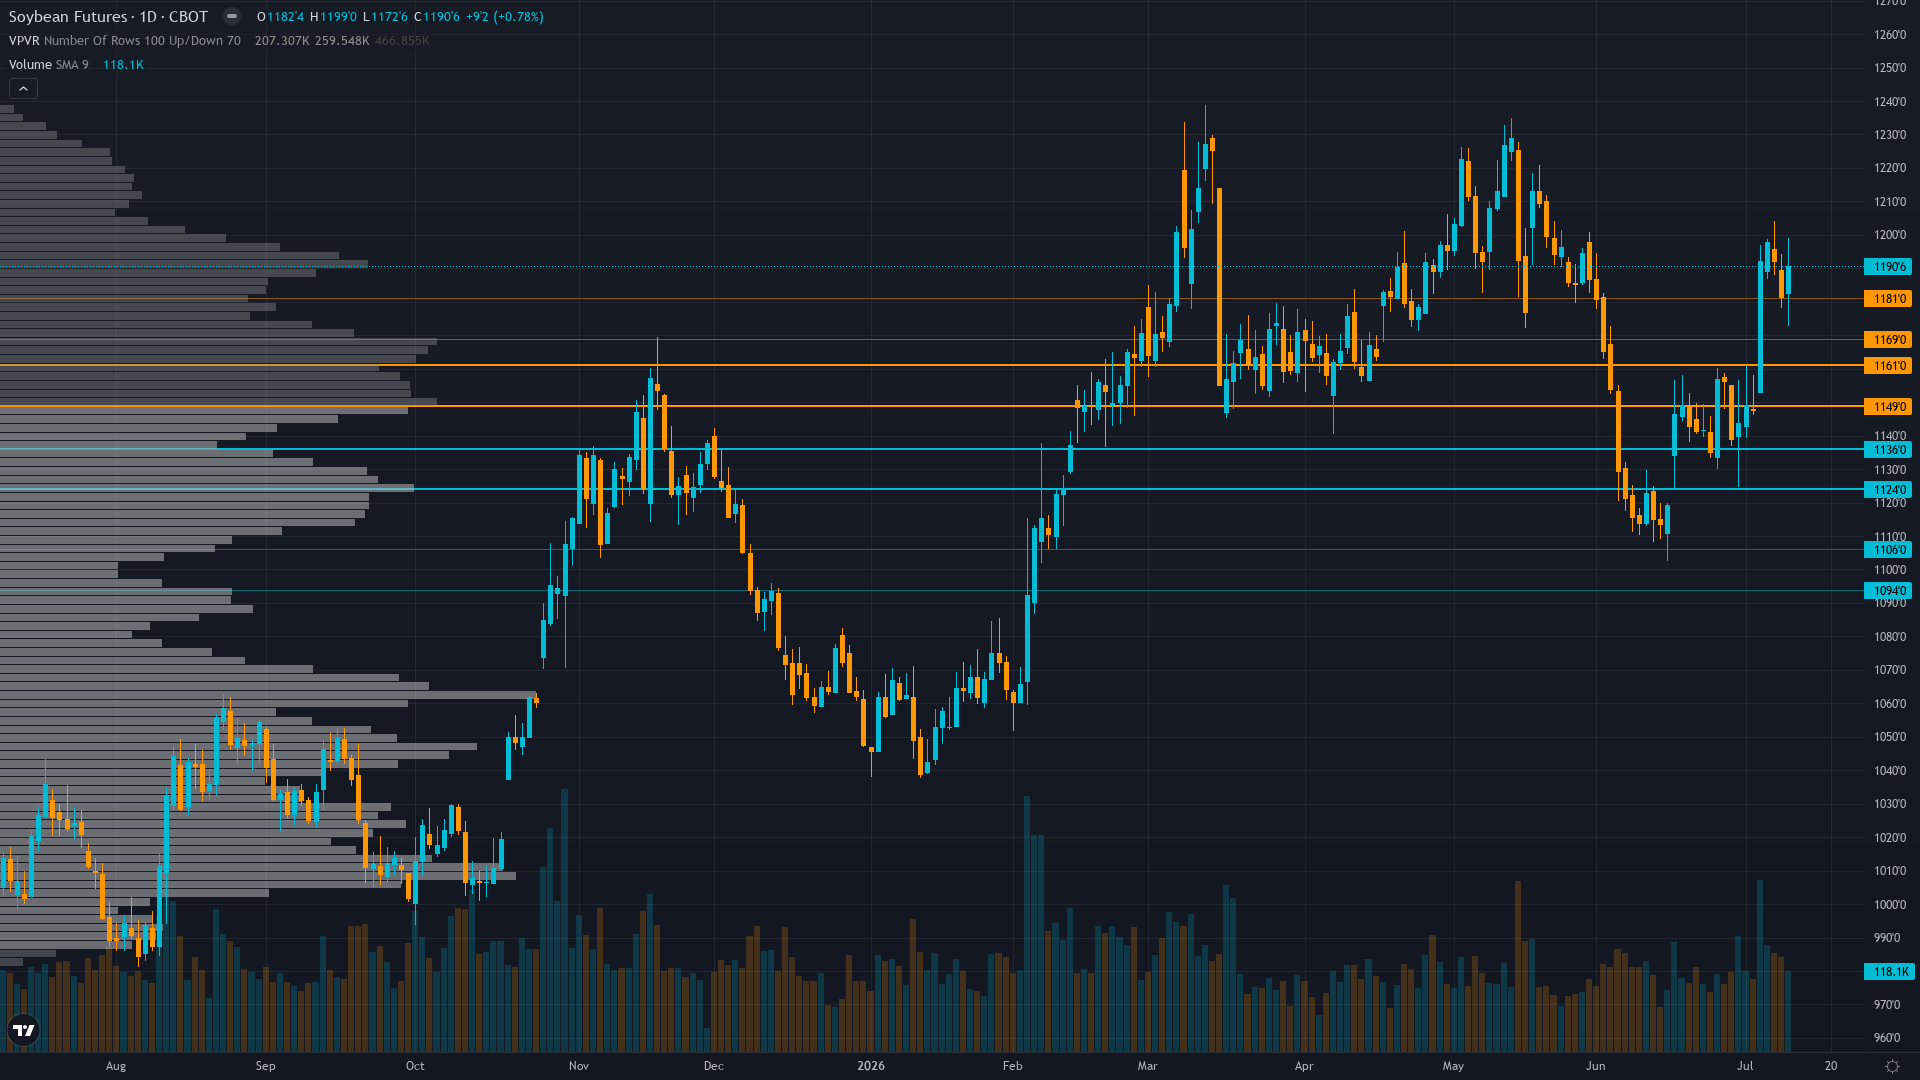
Mixed with fundamental bulls citing July 10 WASDE tightening stocks-to-use and weather risks during critical pollination offset by positioning analysts noting extreme speculative short buildup and export analysts highlighting Brazilian pricing advantages creating range-bound consolidation expectatio
Full Desk
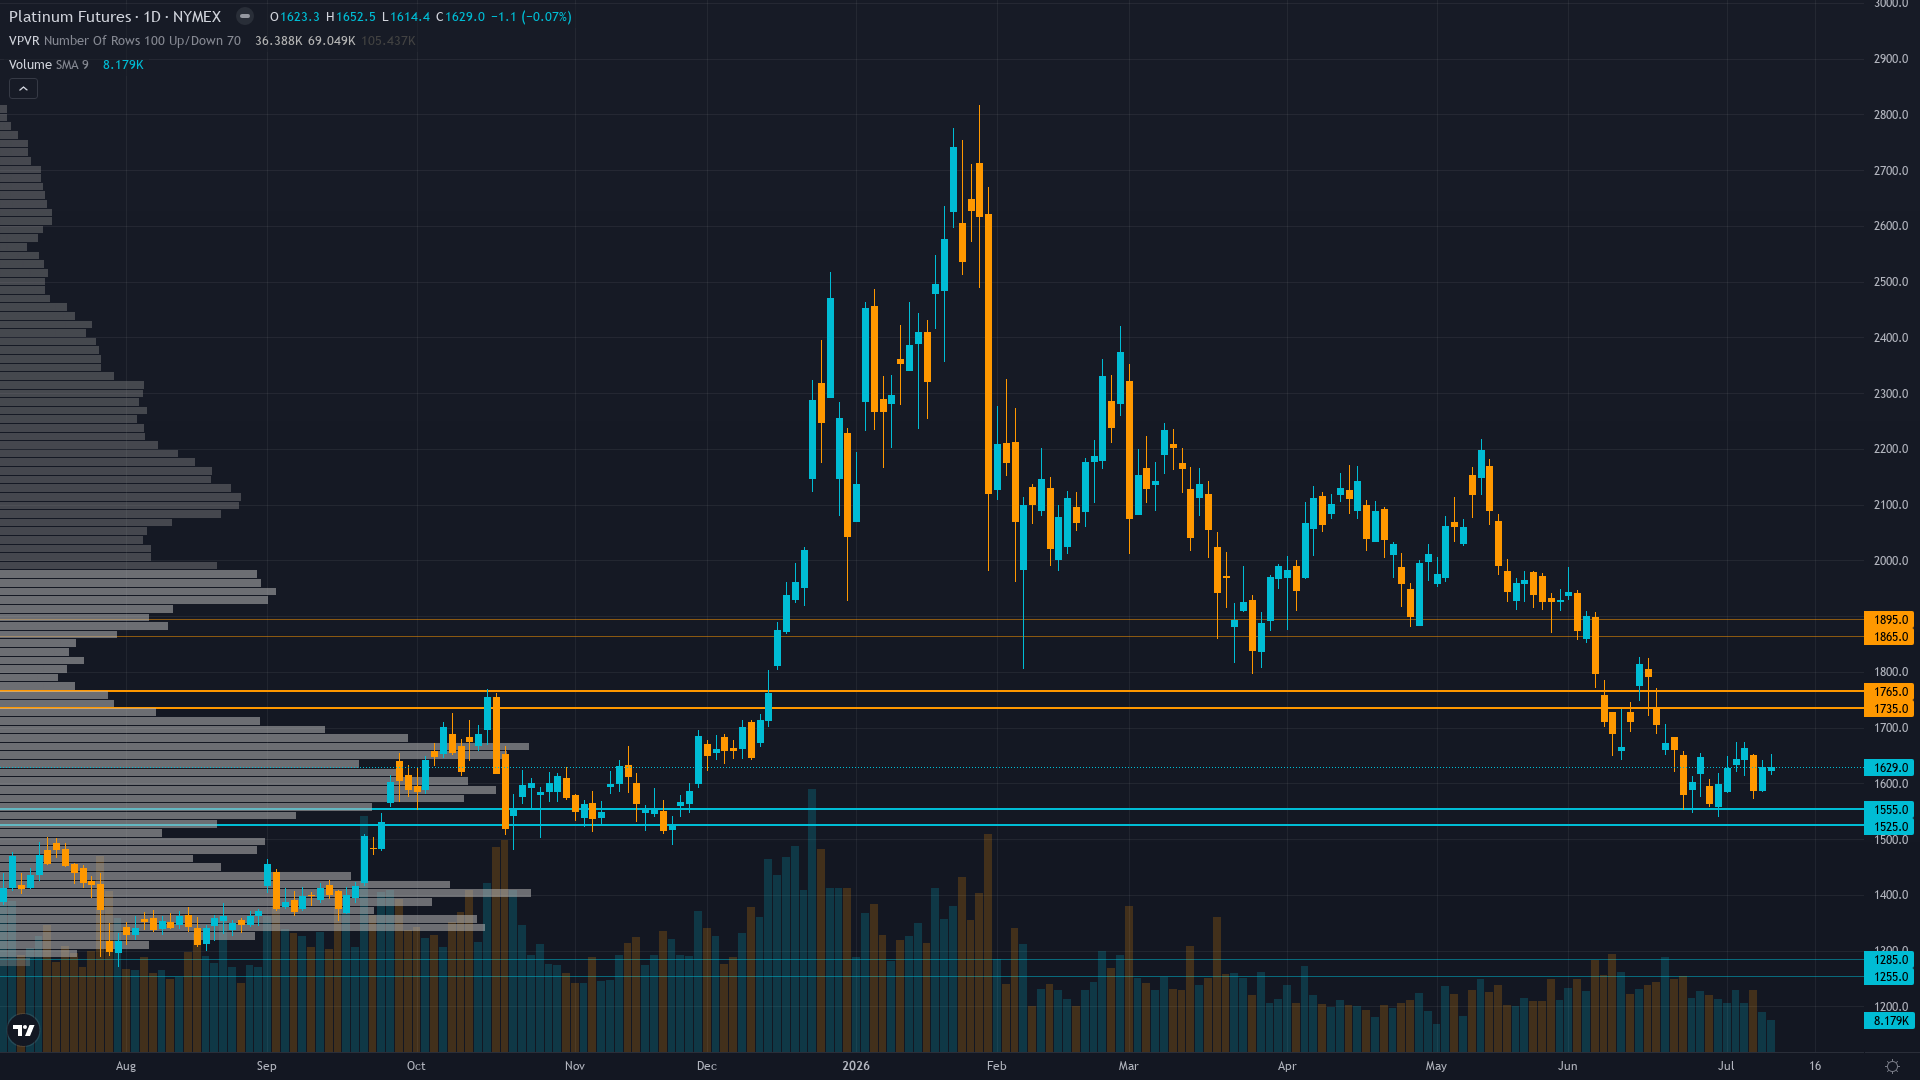
Market violently rejecting WPIC May 18 Q1 2026 report bullish full-year deficit upgrade with -21% decline since announcement, prioritizing Q1 surplus evidence (268 koz first in six quarters from 18% YoY supply growth) over full-year deficit forecast suggesting either forecasting credibility concerns
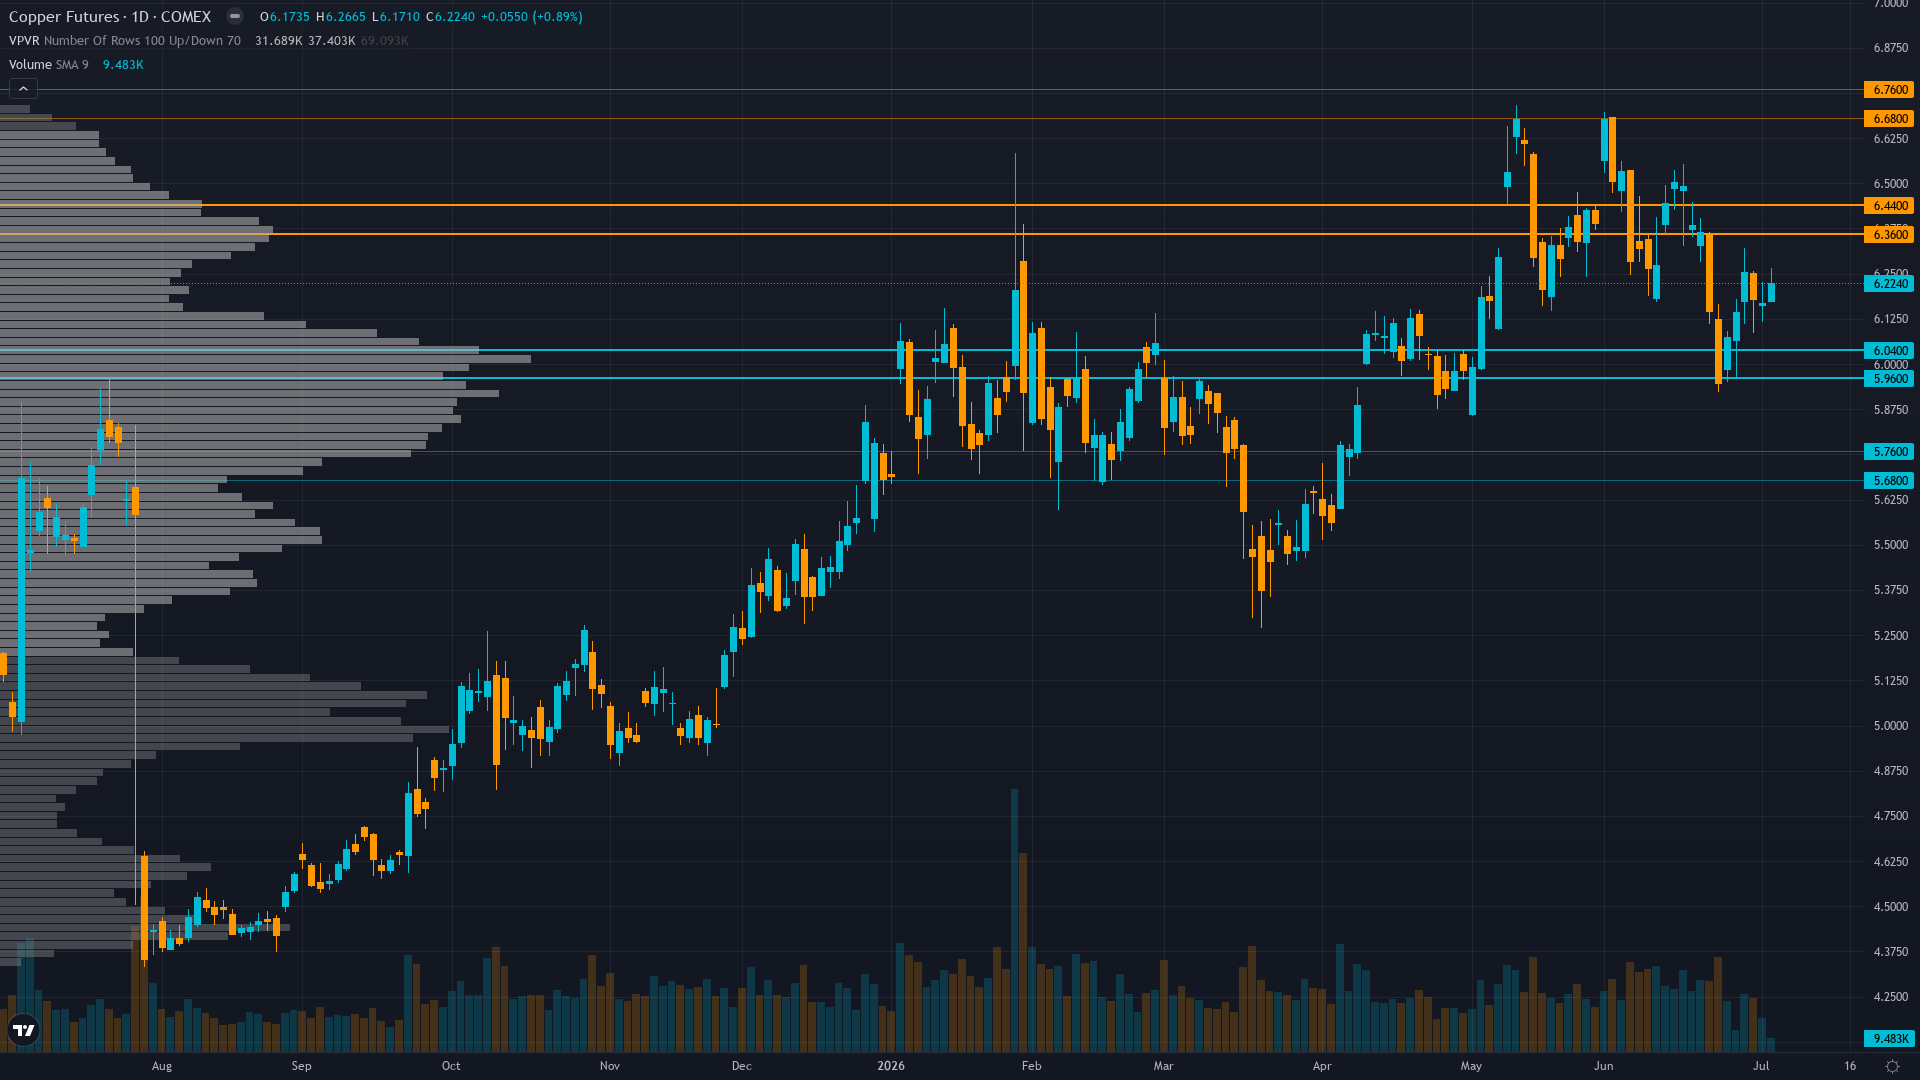
Copper key levels breakdown: support zones, resistance zones, confluence and price structure.
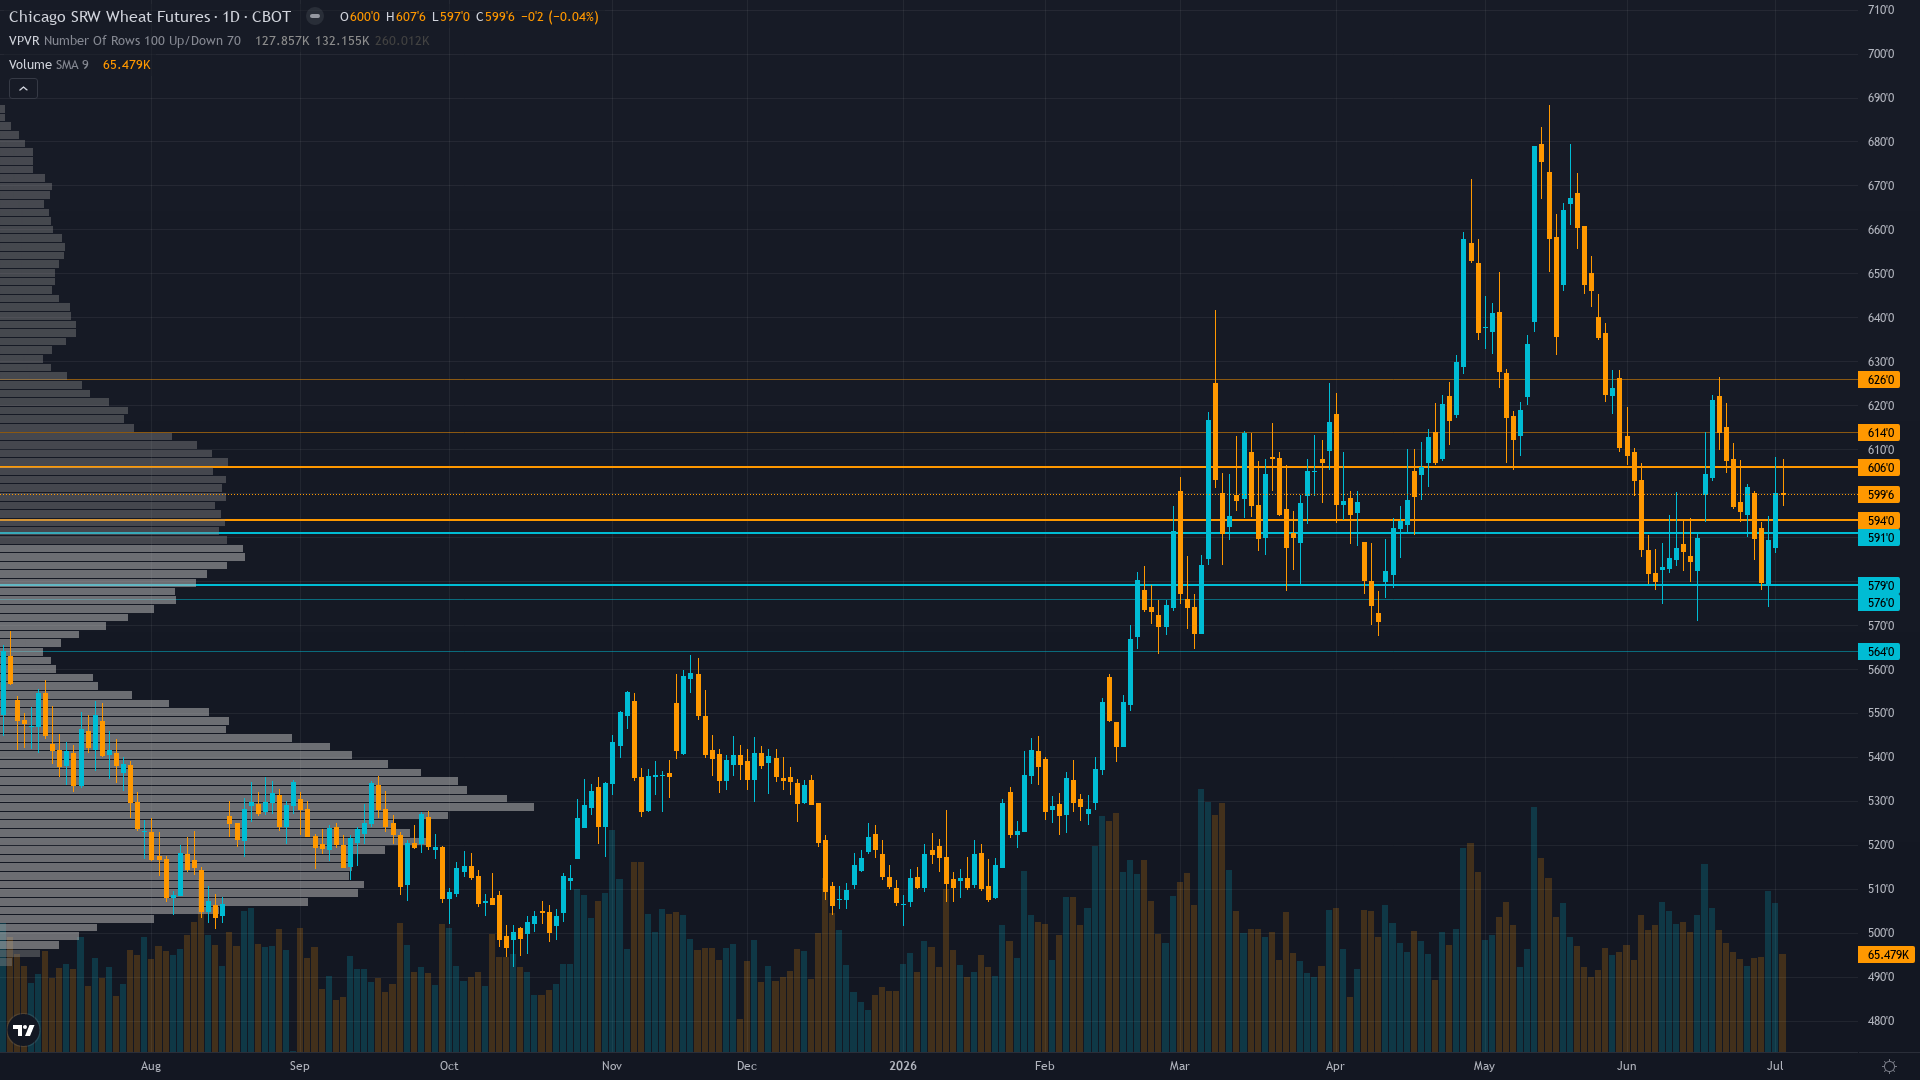
Wheat key levels breakdown: support zones, resistance zones, confluence and price structure.
Wheat institutional positioning: COT data, sentiment analysis and smart money flow assessment.