Gold Forecast This Week — Outlook, Drivers & Key Levels
This week's Gold outlook: key drivers, volatility context, risk-opportunity assessment and the week ahead.

Current Market Picture
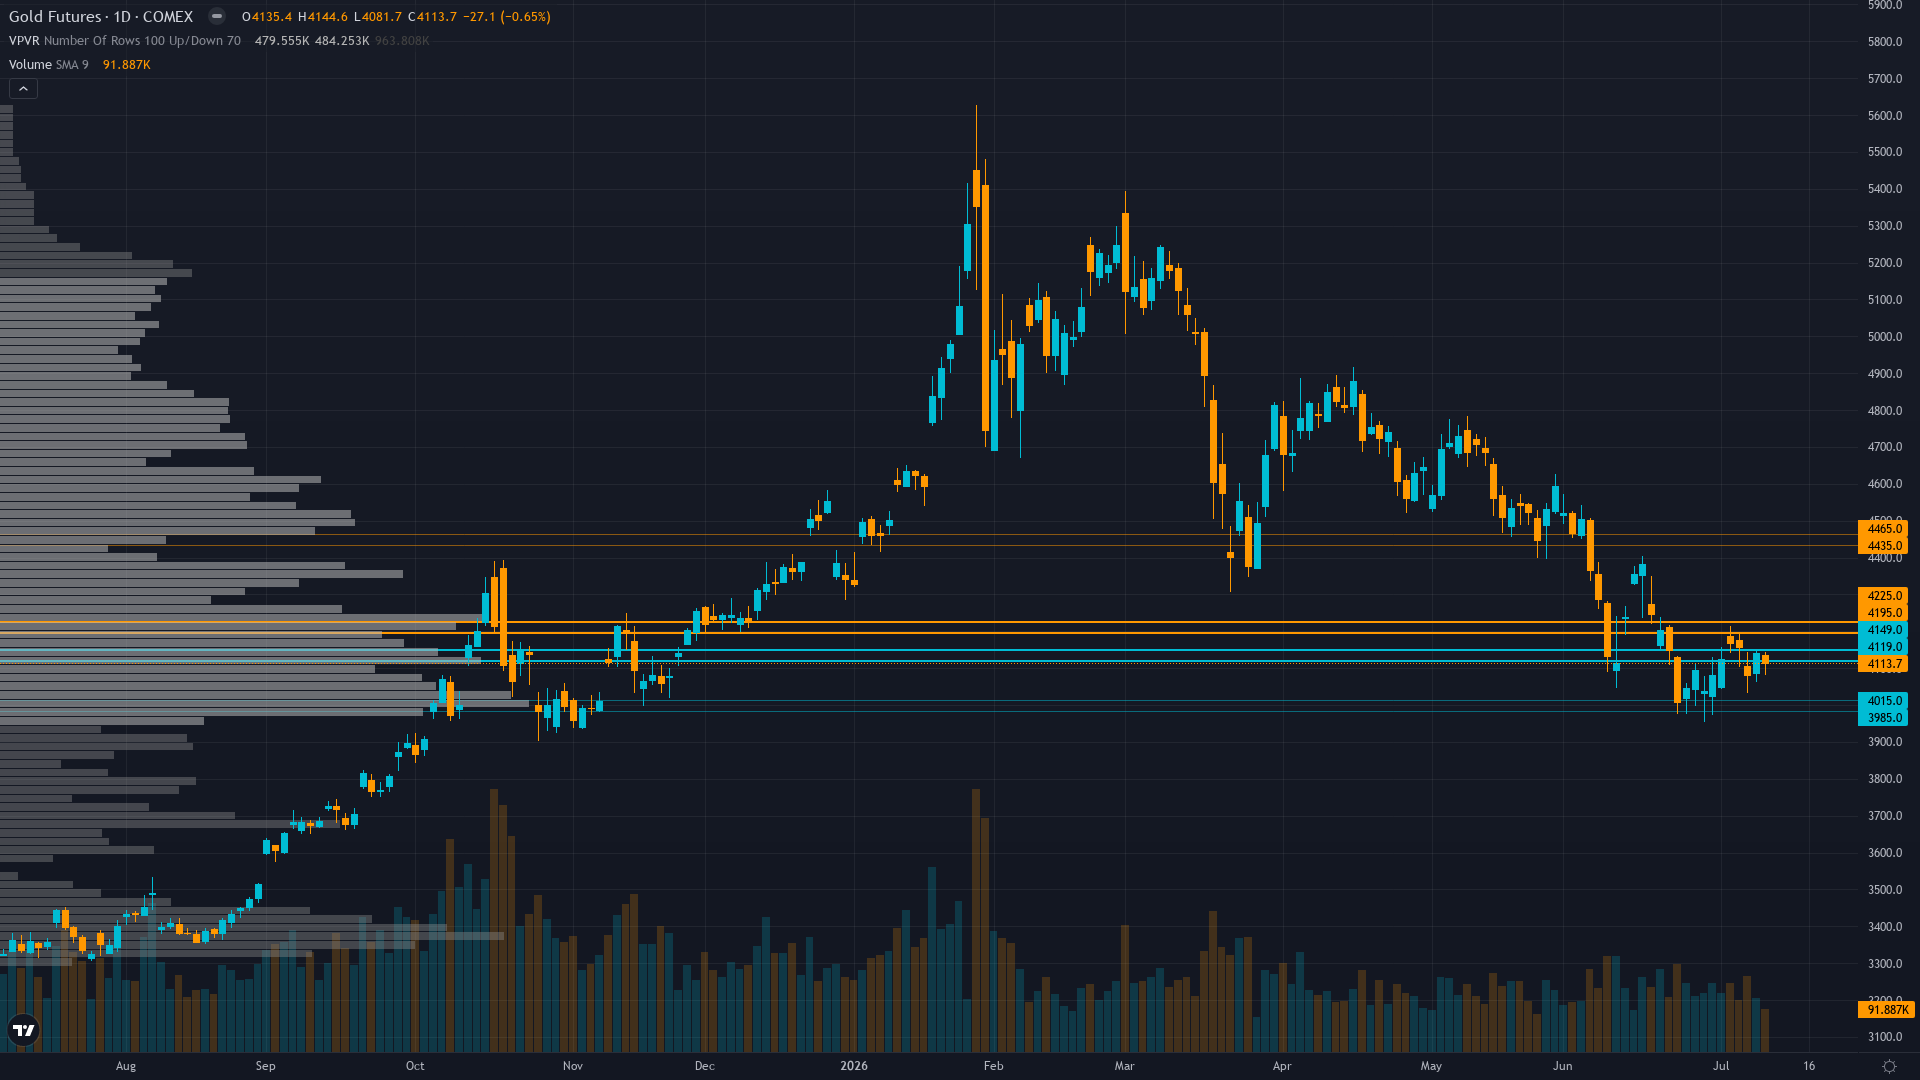
gold sits at 4113.7 after slipping 0.65% — a shallow pullback rather than a decisive move. gold futures is in a breaking down market state, requiring careful assessment of current conditions.
Deeply divided with institutional year-end targets ranging from $4,900 (Goldman Sachs revised lower) to $6,300 (JPMorgan) maintaining structural bull case but near-term positioning increasingly bearish following July 1 Treasury yield shock, June ETF outflows $5.3B, and 27% correction from January peaks creating elevated tactical caution amid July seasonal weakness
Key Drivers This Week
Primary driver: MANDATORY MISS RESET PROTOCOL: 11 consecutive MISSED graded calls catastrophically exceeding the 4-miss threshold for GC requires NEUTRAL stance per Rule 5 while gold extends historic breakdown to $4,114 (down 27% from January $5,627 peak) amid July 1 Treasury yield shock that drove 30Y yields up 0.86% in single session to 4.902% triggering $5.3B ETF outflows in June
Secondary factor: Fundamental discipline flipped dramatically BEARISH this week (-3.5 conf 8) citing gold significantly overvalued versus 4.902% real yield environment with massive ETF redemptions $5.3B June representing institutional liquidation offsetting Q1 central bank demand 244t creating bifurcated market between Eastern official buying and Western capitulation
Additional influence: Technical death cross confirmed with price $4,114 decisively below both 50-day and 200-day moving averages in sustained downtrend, RSI neutral showing no bullish divergence, while Economic/Institutional agents also bearish creating 4-of-6 discipline bearish consensus amid July seasonal weakness typically preceding August-September strength window
Economic backdrop: Fed held June 17 at 3.50-3.75% with July 28-29 FOMC priced 78% hold, but July 1 Treasury yield shock (30Y up 0.86% to 4.902%) represents fresh material catalyst driving real yields to hostile levels for non-yielding gold, DXY at 100.97 providing moderate headwind, VIX 15.03 below 20 indicating RISK-ON regime
Fundamental assessment: Materially overvalued at $4,114 versus real yield environment per Fundamental agent citing 30Y Treasury yield 4.902% and June ETF outflows $5.3B as evidence of fundamental repricing, though Q1 central bank demand 244t provides structural floor creating tension between cyclical bearish versus structural bullish forces
Price Structure
Death cross confirmed, price $4,114 extends 27% decline from January $5,627 all-time high trading below both 50-day and 200-day MAs with RSI neutral at 48, tested intraday low $4,082 July 12 representing critical support zone before major psychological $4,000 level
Trend strength registers just 2/10, which typically corresponds to choppy, directionless price action.
Upside & Downside
Primary risk: Gold breaks decisively below $4,000 psychological support validating July FOMC maintains hawkish stance and Treasury yields remain elevated above 4.5% 10Y nominal, triggering accelerated positioning liquidation driving toward $3,800-3,600 zone representing additional 5-10% downside as Western institutional capitulation overwhelms Eastern central bank structural bid (Probability: medium)
Primary opportunity: July FOMC delivers unexpectedly dovish guidance suggesting July 1 Treasury yield spike was temporary market overreaction triggering dollar reversal from current DXY 100.97 level and Treasury yield normalization below 4.3% 10Y, supporting gold rally toward $4,450-4,600 resistance within 2-3 weeks as ETF flows stabilize and $4,000 psychological support holds (Timeframe: Next 2-4 weeks through July 29 FOMC and into early August as market digests whether current $4,114 level represents climactic washout low amid July seasonal weakness or continuation toward $3,800-4,000 major support zone requiring extended consolidation)
This week's edge: Resetting after 11 consecutive misses per Rule 5 — thesis under mandatory review. Market divided between structural bull case (Q1 central bank demand 244t, institutional targets $4,900-6,300) and cyclical breakdown (July 1 Treasury yield shock 30Y to 4.902%, June ETF outflows $5.3B, death cross, July seasonal weakness). Desk lacks clear informational edge in current environment and requires July 29 FOMC catalyst and August seasonal turn for directional clarity before resuming directional calls.
Volatility Context
At the 82th percentile of its 90-day range, gold price volatility is running hot, creating both opportunity and risk for directional traders. Realised vol is declining steadily, compressing into ranges that tend to snap when a catalyst breaks the equilibrium.
Elevated volatility at 82nd percentile requires wider stops with daily ranges potentially 2.5-3.5% versus normal 1.5-2.0%; current $4,000-4,200 breakdown zone suggests breakouts become more reliable once volatility normalizes below 70th percentile post-July FOMC, but until then price action subject to elevated noise and false signal risk creating unfavorable environment for directional conviction
Week Ahead Outlook
The next major catalyst is Federal Reserve FOMC Meeting July 28-29 with statement and Powell press conference critical for assessing whether June Treasury yield shock represents new baseline or temporary spike, market pricing 78% hold at 3.50-3.75% with forward guidance on inflation trajectory key driver for real yield path on Wednesday 29 July — a high-impact event that could materially shift the directional picture.
For GC futures, the balance between existing momentum and scheduled risk events sets the stage for the week ahead.
This analysis covers one dimension. Our full weekly report combines six specialist agents into a single actionable briefing with directional bias, key levels, and risk-opportunity matrix.
Start Free — Get the Market of the WeekFree weekly report · No credit card · Upgrade anytime



