TRANSITIONAL WITH VIX AT 16.15-16.45 (NEUTRAL ZONE BELOW 20 THRESHOLD INDICATING BALANCED EQUITY MARKET PSYCHOLOGY NEITHER FEAR NOR GREED), USD TRADING IN 99.64-105.42 RANGE PER LONG FORECAST WITH RECENT -0.66% DAILY DECLINE TO 100.77 LEVEL PER TRADINGVIEW PROVIDING MILD U.S. EXPORT COMPETITIVENESS SUPPORT, CRUDE OIL ELEVATED AT $105/BBL (BRENT JUNE-JULY EIA FORECAST) DUE TO GEOPOLITICAL STRAIT OF HORMUZ DISRUPTIONS RAISING AGRICULTURAL INPUT COSTS, CREATING MIXED CROSS-CURRENTS WHERE IMPROVING RISK APPETITE CLASHES WITH COMMODITY-SPECIFIC SUPPLY-DEMAND TENSIONS ALLOWING AGRICULTURAL FUNDAMENTALS TO DOMINATE DIRECTIONAL DYNAMICS
The Institutional Landscape
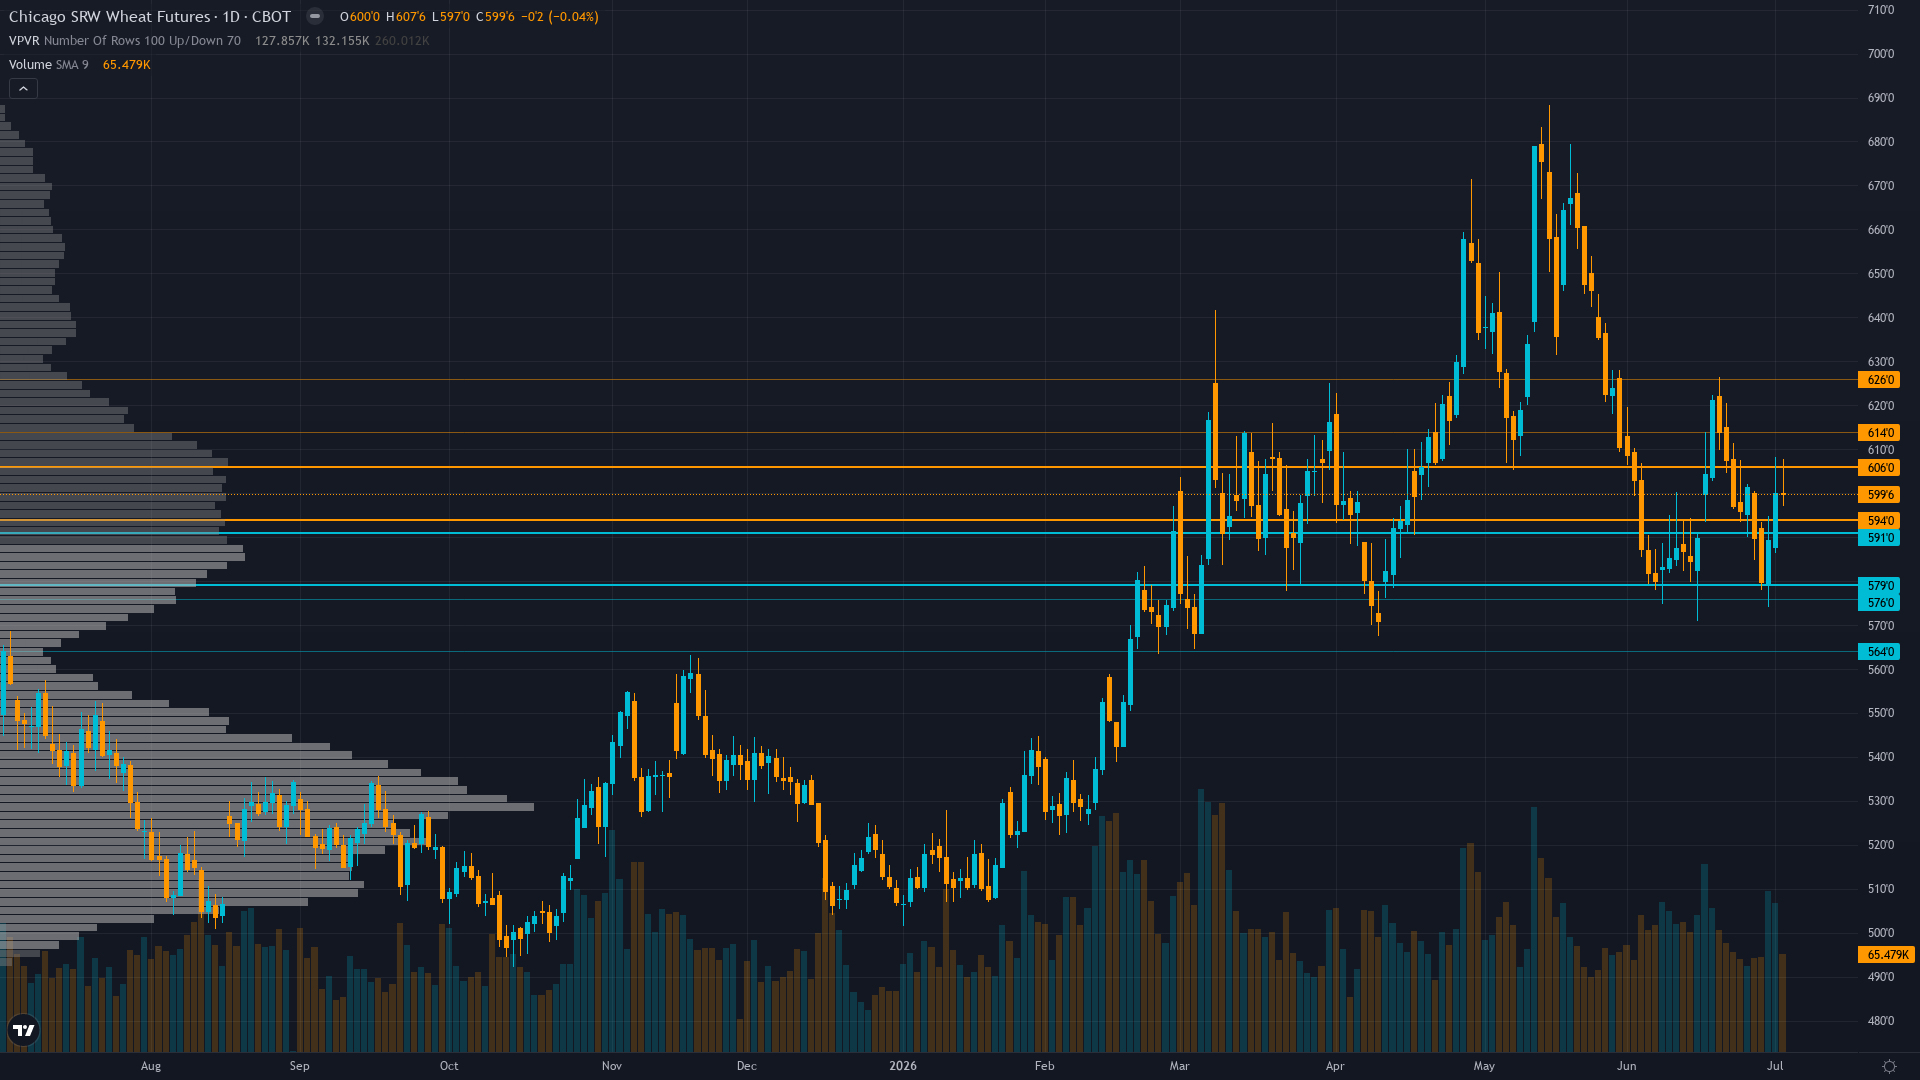
wheat holds at 599.75, up a marginal 0.12% as the market grinds forward.
Managed money at 2026 net short maximum positioning approaching extreme per AgWeb June 29 analysis with funds at maximum 2026 bearish stance after adding 14,000+ shorts through late May into June, removing downside squeeze fuel yet creating contrarian setup where specs maximally short against June 11 WASDE catastrophic U.S. production data (1,048M bushels lowest since 1957 for Hard Red Winter) presents asymmetric short-covering risk if July 10 WASDE confirms additional production downgrades
Market Sentiment
The sentiment picture for wheat futures is evenly split, providing no contrarian signal in either direction. The next move will likely be event-driven.
What Options Markets Show
Implied volatility at 30.87% for July 2026 options reflects moderate two-way risk in normal range for agricultural commodities yet thin wheat options markets provide minimal directional signal with insufficient put/call ratio data and no notable unusual activity identified limiting options intelligence contribution to directional bias formation
Consensus vs MAD View
Market consensus: Mixed to cautiously neutral with fundamental analysts acknowledging June 11 WASDE catastrophic U.S. production shock (1,048M bushels Hard Red Winter lowest since 1957) yet skeptical about sustainability of drought premium given global stocks at 31.7% stocks-to-use ratio (275.42 MMT) expecting seasonal June-August harvest pressure to contain upside near 610-625 resistance while managed money at 2026 net short maximum suggests positioning reflects bearish consensus awaiting July 10 WASDE clarity
Primary driver: July 10 WASDE binary event risk 5 days away creates mandatory analytical caution while wheat consolidates at 599.75 cents in 556-625 range with conflicting discipline signals: managed money at 2026 net short maximum (extreme bearish positioning creating contrarian squeeze potential) clashes with global stocks at 31.7% stocks-to-use ratio (275.42 MMT) overwhelming June 11 WASDE catastrophic U.S. production shock (1,048M bushels lowest Hard Red Winter since 1957)
The Bottom Line on Positioning
The positioning mosaic for ZW futures combines neutral sentiment with stable volatility conditions. Trend strength sits at 4/10, reflecting moderate directional pressure without clear dominance. Taken together, institutional behaviour, crowd psychology, and derivatives data frame the setup heading into the new week.
Consensus vs Reality
Last Week's Consensus
“Mixed to bearish following June 11 WASDE production shock that has been fully priced with market viewing U.S. supply destruction as insufficient to overcome global stocks at 951.5 million tonnes (34.52% stocks-to-use ratio) expecting seasonal June-August harvest pressure to drive prices toward 570-580 support as structural oversupply narrative dominates despite catastrophic domestic production data”
▲
What Actually Happened
+1.87%
588.75 → 599.75
Quick Answers
What is the current outlook for Wheat?
Mixed to cautiously neutral with fundamental analysts acknowledging June 11 WASDE catastrophic U.S. production shock (1,048M bushels Hard Red Winter lowest since 1957) yet skeptical about sustainability of drought premium given global stocks at 31.7% stocks-to-use ratio (275.42 MMT) expecting seasonal June-August harvest pressure to contain upside near 610-625 resistance while managed money at 2026 net short maximum suggests positioning reflects bearish consensus awaiting July 10 WASDE clarity
What are the key factors influencing Wheat right now?
July 10 WASDE binary event risk 5 days away creates mandatory analytical caution while wheat consolidates at 599.75 cents in 556-625 range with conflicting discipline signals: managed money at 2026 net short maximum (extreme bearish positioning creating contrarian squeeze potential) clashes with global stocks at 31.7% stocks-to-use ratio (275.42 MMT) overwhelming June 11 WASDE catastrophic U.S. production shock (1,048M bushels lowest Hard Red Winter since 1957)
Is Wheat volatility high or low right now?
The volatility profile for Wheat shows a high regime at the 65th 90-day percentile. The vol trend is stable, with short-term (28.5%), medium-term (30%), and longer-term (27.5%) readings reflecting the current environment.
What seasonal patterns affect Wheat?
Seasonal analysis for Wheat in July 2026 indicates a bearish lean, backed by a 42% historical win rate. Harvest pressure as supply hits market.
What is the smart money doing in Wheat?
Managed money at 2026 net short maximum positioning approaching extreme per AgWeb June 29 analysis with funds at maximum 2026 bearish stance after adding 14,000+ shorts through late May into June, removing downside squeeze fuel yet creating contrarian setup where specs maximally short against June 11 WASDE catastrophic U.S. production data (1,048M bushels lowest since 1957 for Hard Red Winter) presents asymmetric short-covering risk if July 10 WASDE confirms additional production downgrades
This analysis covers one dimension. Our full weekly report combines six specialist agents into a single actionable briefing with directional bias, key levels, and risk-opportunity matrix.