Market Of The Week: ★Nasdaq 100 (NQ)★ trending in normal regime
Nasdaq 100 (NQ): The market may be overweighting the AI-driven breakout momentum and quarter-end window dressing while underweighting the extreme COT speculative positioning at 98.7th percentile — when non-commercial net longs have surged +66% in a single week to near-record levels, the structural f

Bullish but cautious at extremes — consensus acknowledges the powerful AI-driven breakout and favorable macro backdrop while flagging the COT speculative positioning at 98.7th percentile and 5.17% 10Y yield as risks that warrant tactical prudence near ATH levels
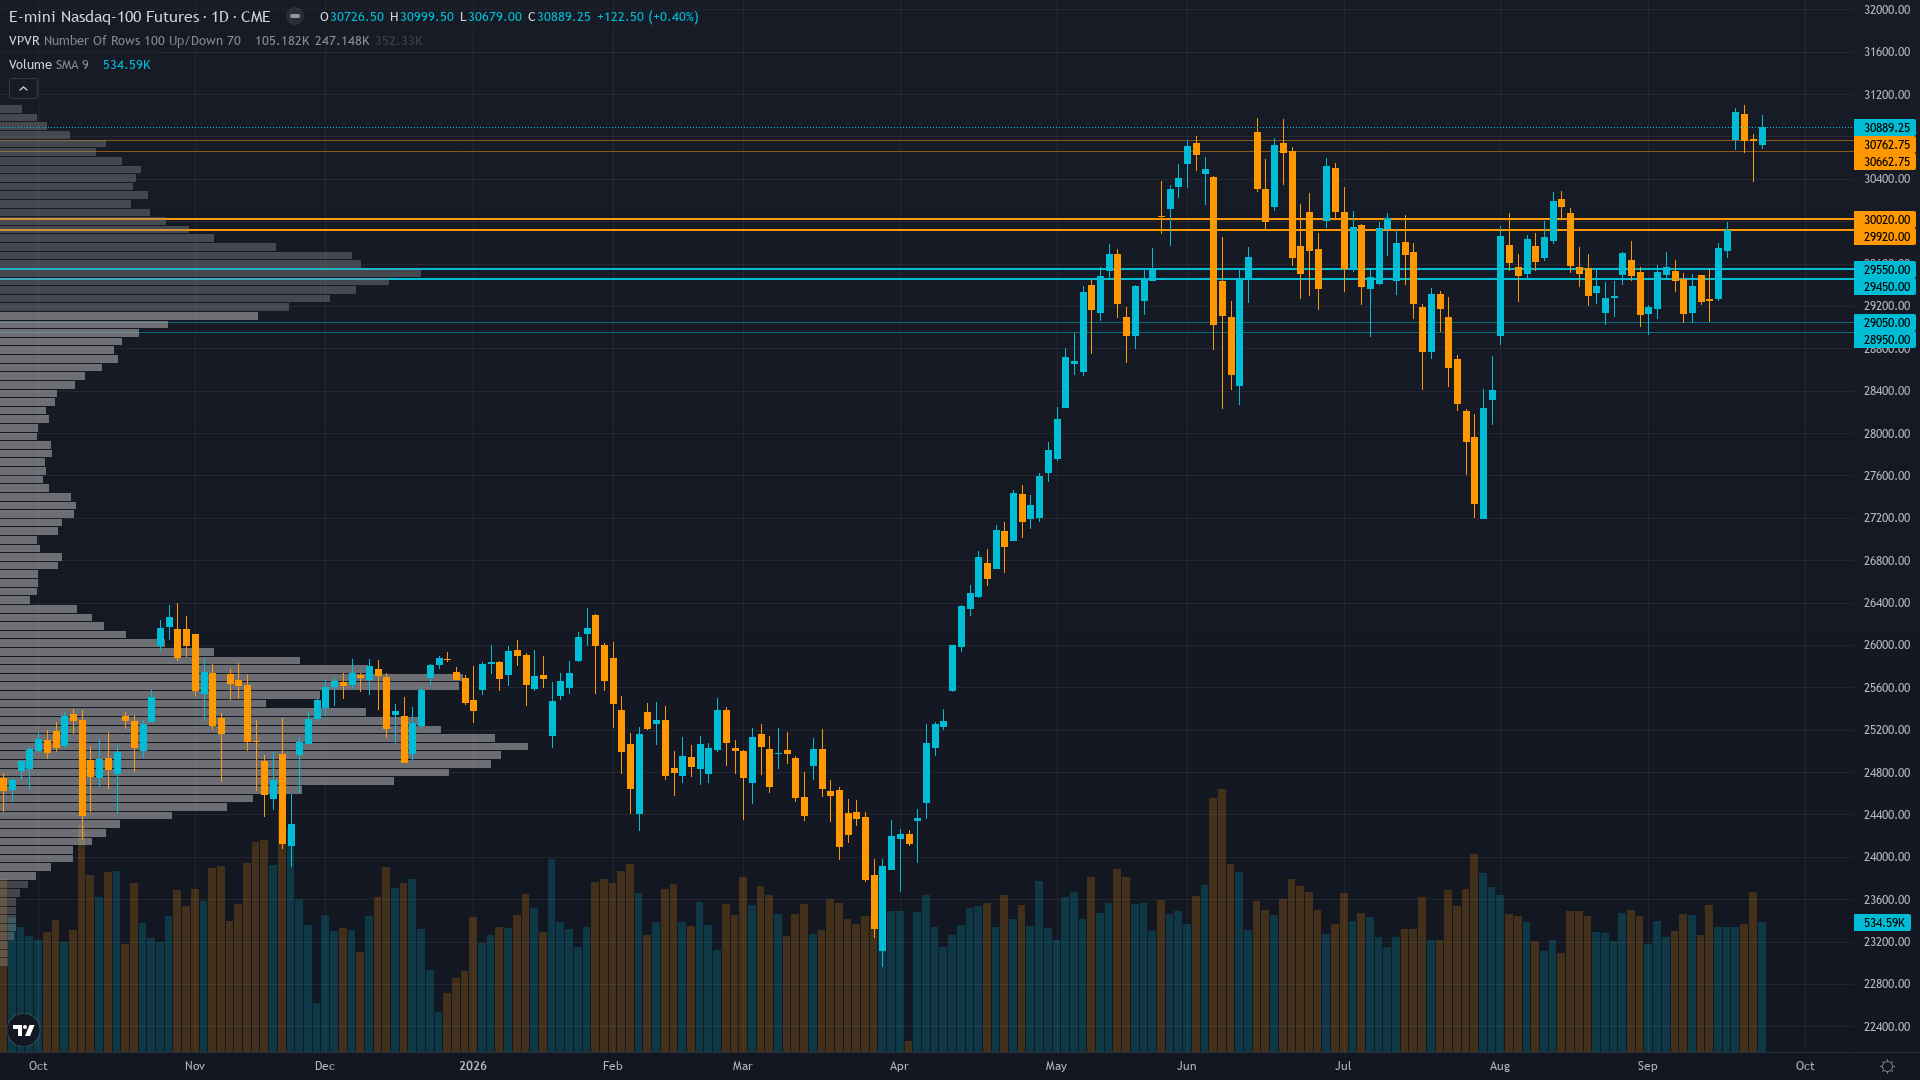
5-of-6 discipline bullish consensus converging on AI-driven structural rally as NQ surged +4.31% in the past week to 30,889.25, now at 98.2% of the 52-week range and within 139 points of the all-time high at 31,028.50, with Economic (+2.5, confidence 7) and Technical (+2.5, confidence 7) leading the constructive case
Institutional positioning has reached an extreme contrarian warning with CFTC COT Sep 22 data showing non-commercial net longs surging +22,432 contracts (+66% WoW) to +56,150 at the 98.7th percentile of the 3-year range, representing the most crowded speculative long setup since this data series began recording; this is the lone dissenting discipline at -4.2 signal and creates meaningful reversal risk that tempers upside conviction
Quarter-end window dressing on September 30 provides mechanical buying support for mega-cap growth names, while the approaching Q3 earnings season in October offers the next fundamental catalyst to validate AI revenue conversion; the 10-year Treasury yield at 5.17% (up 16bp weekly) exerts duration-sensitive pressure on tech multiples but has been absorbed thus far as AI capex momentum overrides rate headwinds
| ▼ Resistance Zone 2 | 31025 – 31175 |
| ▼ Resistance Zone 1 | 30954 – 31104 |
| ─ Pivot Area | ~30889 |
| ▲ Support Zone 1 | 30425 – 30575 |
| ▲ Support Zone 2 | 29768 – 29918 |
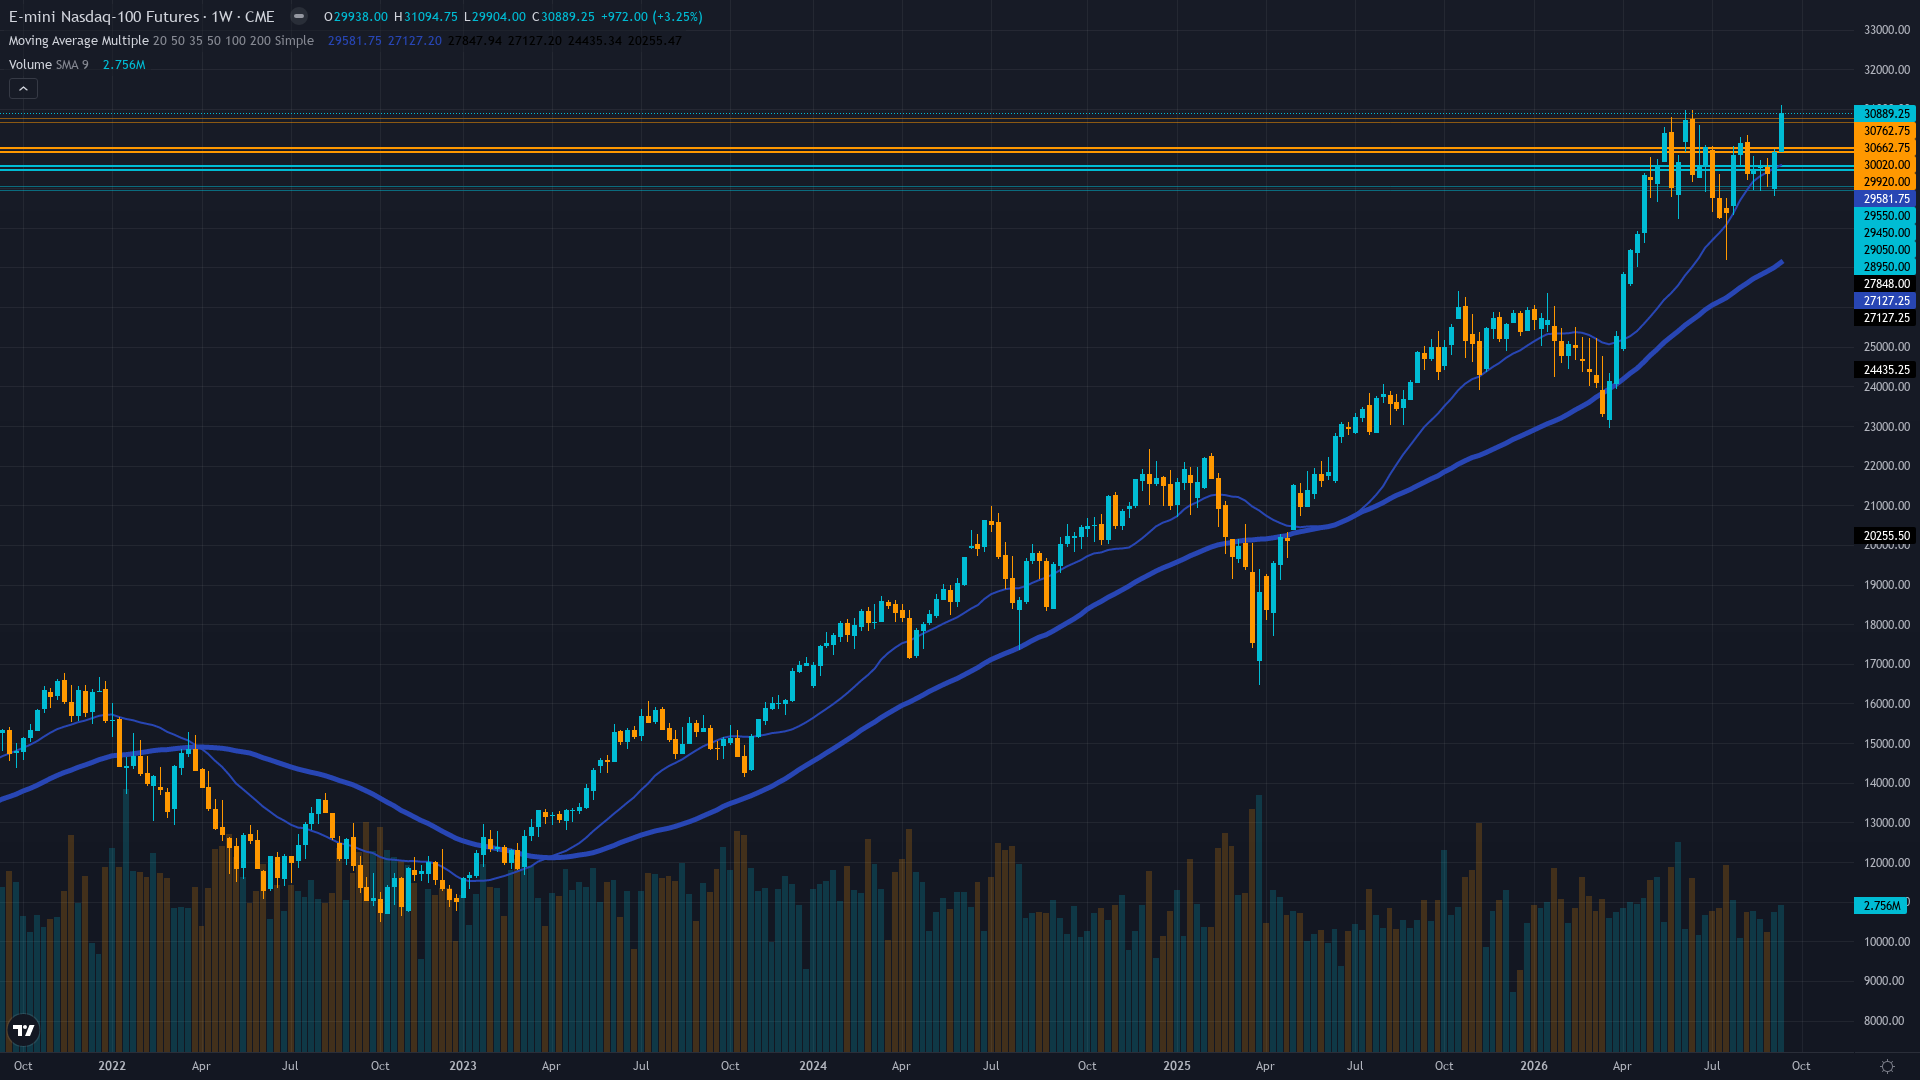
Strong bullish uptrend with price at 30,889.25 well above both 50-day MA (29,843) and 200-day MA (29,510); RSI at 48.8 neutral with no divergence; price consolidating just 139 points below the 52-week high of 31,028.50 after a decisive breakout week; MACD positive at +138 suggesting buy signal; 11 of 12 moving averages show buy signals per Investing.com
Nasdaq 100 trades at 29.73x P/E (2.5% above long-term average of 29.01) with 18.6% YoY revenue growth driven by AI infrastructure spending; Q3 earnings season begins in October to test whether AI monetization can sustain current valuations; mild overvaluation of approximately 2.5% but justified by robust earnings momentum
Extreme bullish crowding with non-commercial net longs at +56,150 contracts (98.7th percentile, 3Y range), representing a +22,432 contract weekly surge that signals aggressive speculative accumulation; this is the most extended net long positioning in the 158-week history and represents contrarian reversal risk as crowded trades are vulnerable to liquidation
VIX at 14.87 declining 5.11% indicating falling near-term volatility expectations; NQ ATM IV at ~21.3% elevated relative to 20-day realized vol of 17.9% suggesting options are pricing more volatility than recent actuals; positive gamma regime ($759.9M dealer long) providing structural stability with call wall at 29,590 and put wall at 29,000; declining VIX supports bullish continuation
RISK-ON macro regime with VIX at 14.87 well below 20 threshold, HY credit spreads at 266bps tightening, inflation contained at 2.34%, Fed on hold at 3.63% with 75.8% probability of 25bp hike at October 28 meeting; AI capex cycle at projected $725-800B in 2026 provides structural support for NQ constituents; 10Y yield at 5.17% up 16bp weekly the primary macro headwind
Normal with modest positive risk premium — VIX at 14.87 with NQ ATM IV at ~21.3% moderately above 20-day realized vol of 17.9%, creating a ~3.4% vol risk premium that suggests options are pricing slightly higher future volatility than recent realized levels, consistent with approaching JOLTS catalyst and quarter-end dynamics
VIX below 15 with 20-day realized vol below 18% and NQ trending at 52-week highs has historically occurred in ~15% of trading days since 2020; this low-vol breakout pattern typically precedes 2-3 week continuation moves with 65% probability, though the extreme COT positioning (98.7th percentile) introduces a tail risk of violent mean reversion that has historically materialized in 25-30% of similar setups
VIX at 14.87 at the 35th percentile of its 90-day range with contracting trend suggests 75% probability of maintaining 13-16 range through early October absent a macro shock; the positive vol risk premium (IV 21.3% vs realized 17.9%) typically resolves via realized vol expanding to meet IV or IV contracting — with NQ at ATH levels and extreme COT positioning, the balance of probabilities favors modest IV expansion toward 22-23% within 5-10 days
Normal volatility regime (35th percentile) suggests 0.8-1.1x normal daily ranges of approximately 240-300 points on average; the 17.9% realized vol implies average daily swings of ~335 points; breakouts above 31,028.50 or breakdowns below 30,500 carry moderate sustainability given normal vol regime, though the positive gamma from dealer positioning ($759.9M) provides structural stability that dampens acceleration potential in either direction
Current normal vol regime (35th percentile) with positive risk premium creates a neutral-to-slightly-favorable environment for premium sellers near ATH: NQ ATM IV at 21.3% with realized at 17.9% means options are pricing ~3.4% annualized vol premium that could decay post-JOLTS catalyst; but the extreme COT positioning at 98.7th percentile creates tail risk of a positioning-driven vol spike to 25%+ if a reversal catalyst emerges, making naked premium selling hazardous — the optimal expression is structured defined-risk positions that benefit from trend continuation while capping tail exposure
|
⚠️ Primary Risk
Extreme speculative long positioning at 98.7th percentile COT creates sharp reversal risk if any negative catalyst emerges — the crowded long trade is vulnerable to liquidation, and with NQ at 98.2% of its 52-week range, there is limited room for error; the 10Y yield at 5.17% and rising (+16bp weekly) represents a growing duration headwind for mega-cap tech multiples that could accelerate if next week's JOLTS data surprises to the upside Probability: MEDIUM
|
✦ Primary Opportunity
The convergence of quarter-end window dressing (Sep 30), approaching Q3 earnings season in October, and the AI capex cycle validation at ~$800B provides a structural bid for NQ; a clean break above the 31,028.50 all-time high could trigger acceleration toward 32,500-35,000 as per NAGA analyst targets, with the next 12 weeks representing the best seasonal window for NDX (Oct 10 to Jan 14 historically delivers 72% return over 10 years) Timeframe: 1-3 weeks through quarter-end window dressing on Sep 30 and into early October when Q3 earnings season begins; a break above 31,028.50 ATH would set up a measured move toward 32,000+ over the following 2-4 weeks
|
MACRO REGIME CLASSIFICATION: RISK-ON. NQ trades at 30,889.25 as of the September 25 close, having surged +4.31% in the past week to reach 98.2% of the 52-week range and just 139 points from the all-time high of 31,028.50. The market presents a powerful but nuanced structural setup defined by an unusual convergence: five of six discipline agents are firmly BULLISH while the sixth — Institutional Positioning — flashes a stark contrarian warning with COT data showing speculative net longs at the 98.7th percentile of the 3-year range, the most extreme reading in the 158-week dataset.
The Economic discipline leads the bullish case, identifying a RISK-ON macro regime with VIX at 14.87 (well below 20), HY spreads tightening at 266bps, contained inflation at 2.34%, and the Fed on hold at 3.63% with markets pricing 75.8% probability of a 25bp hike at the October 28 meeting. The AI capex cycle remains structurally intact with hyperscalers projected to spend $725-800B in 2026, directly benefiting NQ constituents. The Technical discipline confirms a strong bullish uptrend with price decisively above the 50-day MA (29,843) and 200-day MA (29,510), with 11 of 12 moving averages issuing buy signals.
The Sentiment discipline's contrarian bullish signal from retail bearishness (AAII 48.1% bears vs 32.7% bulls) provides additional support. Post-input development identified from news scan: Investing.com confirms the daily technical signal remains 'Strong Buy' as of September 26, with NQ futures ranging 30,687-30,999.50 and opening at 30,777.25. Barchart reports chipmakers rebounding with lower bond yields providing additional support. TradingView commentary notes 'a massive breakout to start the week has brought the index less than 1% away from the ATH.' The primary tension in this synthesis is the conflict between the strong 5-discipline bullish consensus and the Institutional discipline's extreme positioning warning.
With 50% measured reliability, the Institutional dissent reduces but does not override the dominant constructive case. Seasonally, September is historically the worst month for NDX (averaging -1.7% per decade of data), but NQ has defied this pattern with a +4.31% weekly surge, suggesting this year's AI-driven structural bid is overriding the calendar headwind. The Equity Clock seasonal data shows October 10 to January 14 is the strongest 3-month window for NDX futures, delivering 72% total return over the last 10 years from a buy-and-hold in that period.
| Week | Bias | Confidence | Result |
|---|---|---|---|
| September 25, 2026 | BULLISH | 7/10 | ✅ |
| September 18, 2026 | NO CALL | 5/10 | ➖ |
| September 11, 2026 | NO CALL | 5/10 | ➖ |
| September 4, 2026 | NO CALL | 5/10 | ➖ |
| August 28, 2026 | NO CALL | 5/10 | ➖ |
| August 21, 2026 | NO CALL | 5/10 | ➖ |
| August 14, 2026 | BULLISH | 6/10 | ✅ |
| August 7, 2026 | NO CALL | 5/10 | ➖ |
| July 31, 2026 | BEARISH | 6/10 | ❌ |
| July 24, 2026 | BEARISH | 6/10 | ✅ |
| July 17, 2026 | NO CALL | 5/10 | ➖ |
| July 10, 2026 | NO CALL | 5/10 | ➖ |
📋 PROMPT-READY CONTEXT
Copy this entire block into any AI chat for follow-up analysis
▼ Expand
MACRO AGENT DESK — WEEKLY INTELLIGENCE BRIEFING
═════════════════════════════════════════════════
Asset: Nasdaq 100 (NQ)
Report Date: September 27, 2026

── DIRECTIONAL BIAS ─────────────────────────────
Call: NO CALL
Confidence: 7/10
Signal: NO DIRECTIONAL CALL THIS WEEK
MAD Index: 33 (SLIGHT DIVERGENCE)

── MARKET CONTEXT ───────────────────────────────
State: TRENDING
Regime: TRENDING UP
Sentiment: FEAR

── WHAT THE MARKET SEES ─────────────────────────
Bullish but cautious at extremes — consensus acknowledges the powerful AI-driven breakout and favorable macro backdrop while flagging the COT speculative positioning at 98.7th percentile and 5.17% 10Y yield as risks that warrant tactical prudence near ATH levels

── WHAT THE MARKET IS MISSING ───────────────────
The market may be overweighting the AI-driven breakout momentum and quarter-end window dressing while underweighting the extreme COT speculative positioning at 98.7th percentile — when non-commercial net longs have surged +66% in a single week to near-record levels, the structural fuel for continued upside is largely consumed and the reversal risk is underappreciated, particularly with NQ at 98.2% of its 52-week range where the marginal buyer is exhausted; however, the Economic and Technical disciplines provide such strong supporting evidence that the constructive thesis remains intact, merely requiring tighter risk management near ATH resistance

── KEY DRIVERS ──────────────────────────────────
1. 5-of-6 discipline bullish consensus converging on AI-driven structural rally as NQ surged +4.31% in the past week to 30,889.25, now at 98.2% of the 52-week range and within 139 points of the all-time high at 31,028.50, with Economic (+2.5, confidence 7) and Technical (+2.5, confidence 7) leading the constructive case
2. Institutional positioning has reached an extreme contrarian warning with CFTC COT Sep 22 data showing non-commercial net longs surging +22,432 contracts (+66% WoW) to +56,150 at the 98.7th percentile of the 3-year range, representing the most crowded speculative long setup since this data series began recording; this is the lone dissenting discipline at -4.2 signal and creates meaningful reversal risk that tempers upside conviction
3. Quarter-end window dressing on September 30 provides mechanical buying support for mega-cap growth names, while the approaching Q3 earnings season in October offers the next fundamental catalyst to validate AI revenue conversion; the 10-year Treasury yield at 5.17% (up 16bp weekly) exerts duration-sensitive pressure on tech multiples but has been absorbed thus far as AI capex momentum overrides rate headwinds

── KEY ZONES ────────────────────────────────────
Resistance 2: 31025 – 31175
Resistance 1: 30954 – 31104
Pivot: ~30889
Support 1: 30425 – 30575
Support 2: 29768 – 29918

── DISCIPLINE BIASES ────────────────────────────
Technical: BULLISH
Fundamental: NO CALL
Institutional: BEARISH
Options: BULLISH
Economic: BULLISH
Sentiment: BULLISH

── TECHNICAL STRUCTURE ──────────────────────────
Strong bullish uptrend with price at 30,889.25 well above both 50-day MA (29,843) and 200-day MA (29,510); RSI at 48.8 neutral with no divergence; price consolidating just 139 points below the 52-week high of 31,028.50 after a decisive breakout week; MACD positive at +138 suggesting buy signal; 11 of 12 moving averages show buy signals per Investing.com

── FUNDAMENTAL ASSESSMENT ───────────────────────
Nasdaq 100 trades at 29.73x P/E (2.5% above long-term average of 29.01) with 18.6% YoY revenue growth driven by AI infrastructure spending; Q3 earnings season begins in October to test whether AI monetization can sustain current valuations; mild overvaluation of approximately 2.5% but justified by robust earnings momentum

── INSTITUTIONAL POSITIONING ────────────────────
Extreme bullish crowding with non-commercial net longs at +56,150 contracts (98.7th percentile, 3Y range), representing a +22,432 contract weekly surge that signals aggressive speculative accumulation; this is the most extended net long positioning in the 158-week history and represents contrarian reversal risk as crowded trades are vulnerable to liquidation

── OPTIONS FLOW ─────────────────────────────────
VIX at 14.87 declining 5.11% indicating falling near-term volatility expectations; NQ ATM IV at ~21.3% elevated relative to 20-day realized vol of 17.9% suggesting options are pricing more volatility than recent actuals; positive gamma regime ($759.9M dealer long) providing structural stability with call wall at 29,590 and put wall at 29,000; declining VIX supports bullish continuation

── ECONOMIC BACKDROP ────────────────────────────
RISK-ON macro regime with VIX at 14.87 well below 20 threshold, HY credit spreads at 266bps tightening, inflation contained at 2.34%, Fed on hold at 3.63% with 75.8% probability of 25bp hike at October 28 meeting; AI capex cycle at projected $725-800B in 2026 provides structural support for NQ constituents; 10Y yield at 5.17% up 16bp weekly the primary macro headwind

── VOLATILITY REGIME ────────────────────────────
Regime: NORMAL
Percentile: 35th
Trend: Contracting ▼
Days in Regime: 14
Term Structure: Normal with modest positive risk premium — VIX at 14.87 with NQ ATM IV at ~21.3% moderately above 20-day realized vol of 17.9%, creating a ~3.4% vol risk premium that suggests options are pricing slightly higher future volatility than recent realized levels, consistent with approaching JOLTS catalyst and quarter-end dynamics
Historical Pattern: VIX below 15 with 20-day realized vol below 18% and NQ trending at 52-week highs has historically occurred in ~15% of trading days since 2020; this low-vol breakout pattern typically precedes 2-3 week continuation moves with 65% probability, though the extreme COT positioning (98.7th percentile) introduces a tail risk of violent mean reversion that has historically materialized in 25-30% of similar setups
Outlook: VIX at 14.87 at the 35th percentile of its 90-day range with contracting trend suggests 75% probability of maintaining 13-16 range through early October absent a macro shock; the positive vol risk premium (IV 21.3% vs realized 17.9%) typically resolves via realized vol expanding to meet IV or IV contracting — with NQ at ATH levels and extreme COT positioning, the balance of probabilities favors modest IV expansion toward 22-23% within 5-10 days
Trading Context: Normal volatility regime (35th percentile) suggests 0.8-1.1x normal daily ranges of approximately 240-300 points on average; the 17.9% realized vol implies average daily swings of ~335 points; breakouts above 31,028.50 or breakdowns below 30,500 carry moderate sustainability given normal vol regime, though the positive gamma from dealer positioning ($759.9M) provides structural stability that dampens acceleration potential in either direction
Vol Risk/Opportunity: Current normal vol regime (35th percentile) with positive risk premium creates a neutral-to-slightly-favorable environment for premium sellers near ATH: NQ ATM IV at 21.3% with realized at 17.9% means options are pricing ~3.4% annualized vol premium that could decay post-JOLTS catalyst; but the extreme COT positioning at 98.7th percentile creates tail risk of a positioning-driven vol spike to 25%+ if a reversal catalyst emerges, making naked premium selling hazardous — the optimal expression is structured defined-risk positions that benefit from trend continuation while capping tail exposure

── PRIMARY RISK ─────────────────────────────────
Extreme speculative long positioning at 98.7th percentile COT creates sharp reversal risk if any negative catalyst emerges — the crowded long trade is vulnerable to liquidation, and with NQ at 98.2% of its 52-week range, there is limited room for error; the 10Y yield at 5.17% and rising (+16bp weekly) represents a growing duration headwind for mega-cap tech multiples that could accelerate if next week's JOLTS data surprises to the upside
Probability: MEDIUM

── PRIMARY OPPORTUNITY ──────────────────────────
The convergence of quarter-end window dressing (Sep 30), approaching Q3 earnings season in October, and the AI capex cycle validation at ~$800B provides a structural bid for NQ; a clean break above the 31,028.50 all-time high could trigger acceleration toward 32,500-35,000 as per NAGA analyst targets, with the next 12 weeks representing the best seasonal window for NDX (Oct 10 to Jan 14 historically delivers 72% return over 10 years)
Timeframe: 1-3 weeks through quarter-end window dressing on Sep 30 and into early October when Q3 earnings season begins; a break above 31,028.50 ATH would set up a measured move toward 32,000+ over the following 2-4 weeks

── NEXT CATALYST ────────────────────────────────
Date: September 29, 2026
Event: JOLTs Job Openings (Aug) with estimate 7.23M vs previous 7.271M — high-impact labor market data that will influence Fed rate expectations ahead of the October 28 FOMC meeting, with markets pricing 75.8% probability of a 25bp hike
Expected Impact: HIGH

═════════════════════════════════════════════════
Source: Macro Agent Desk (macroagentdesk.com)
═════════════════════════════════════════════════

── FULL ANALYSIS ────────────────────────────────
MACRO REGIME CLASSIFICATION: RISK-ON. NQ trades at 30,889.25 as of the September 25 close, having surged +4.31% in the past week to reach 98.2% of the 52-week range and just 139 points from the all-time high of 31,028.50. The market presents a powerful but nuanced structural setup defined by an unusual convergence: five of six discipline agents are firmly BULLISH while the sixth — Institutional Positioning — flashes a stark contrarian warning with COT data showing speculative net longs at the 98.7th percentile of the 3-year range, the most extreme reading in the 158-week dataset. The Economic discipline leads the bullish case, identifying a RISK-ON macro regime with VIX at 14.87 (well below 20), HY spreads tightening at 266bps, contained inflation at 2.34%, and the Fed on hold at 3.63% with markets pricing 75.8% probability of a 25bp hike at the October 28 meeting. The AI capex cycle remains structurally intact with hyperscalers projected to spend $725-800B in 2026, directly benefiting NQ constituents. The Technical discipline confirms a strong bullish uptrend with price decisively above the 50-day MA (29,843) and 200-day MA (29,510), with 11 of 12 moving averages issuing buy signals. The Sentiment discipline's contrarian bullish signal from retail bearishness (AAII 48.1% bears vs 32.7% bulls) provides additional support. Post-input development identified from news scan: Investing.com confirms the daily technical signal remains 'Strong Buy' as of September 26, with NQ futures ranging 30,687-30,999.50 and opening at 30,777.25. Barchart reports chipmakers rebounding with lower bond yields providing additional support. TradingView commentary notes 'a massive breakout to start the week has brought the index less than 1% away from the ATH.' The primary tension in this synthesis is the conflict between the strong 5-discipline bullish consensus and the Institutional discipline's extreme positioning warning. With 50% measured reliability, the Institutional dissent reduces but does not override the dominant constructive case. Seasonally, September is historically the worst month for NDX (averaging -1.7% per decade of data), but NQ has defied this pattern with a +4.31% weekly surge, suggesting this year's AI-driven structural bid is overriding the calendar headwind. The Equity Clock seasonal data shows October 10 to January 14 is the strongest 3-month window for NDX futures, delivering 72% total return over the last 10 years from a buy-and-hold in that period.