Gold Forecast This Week — Outlook, Drivers & Key Levels
This week's Gold outlook: key drivers, volatility context, risk-opportunity assessment and the week ahead.

Current Market Picture
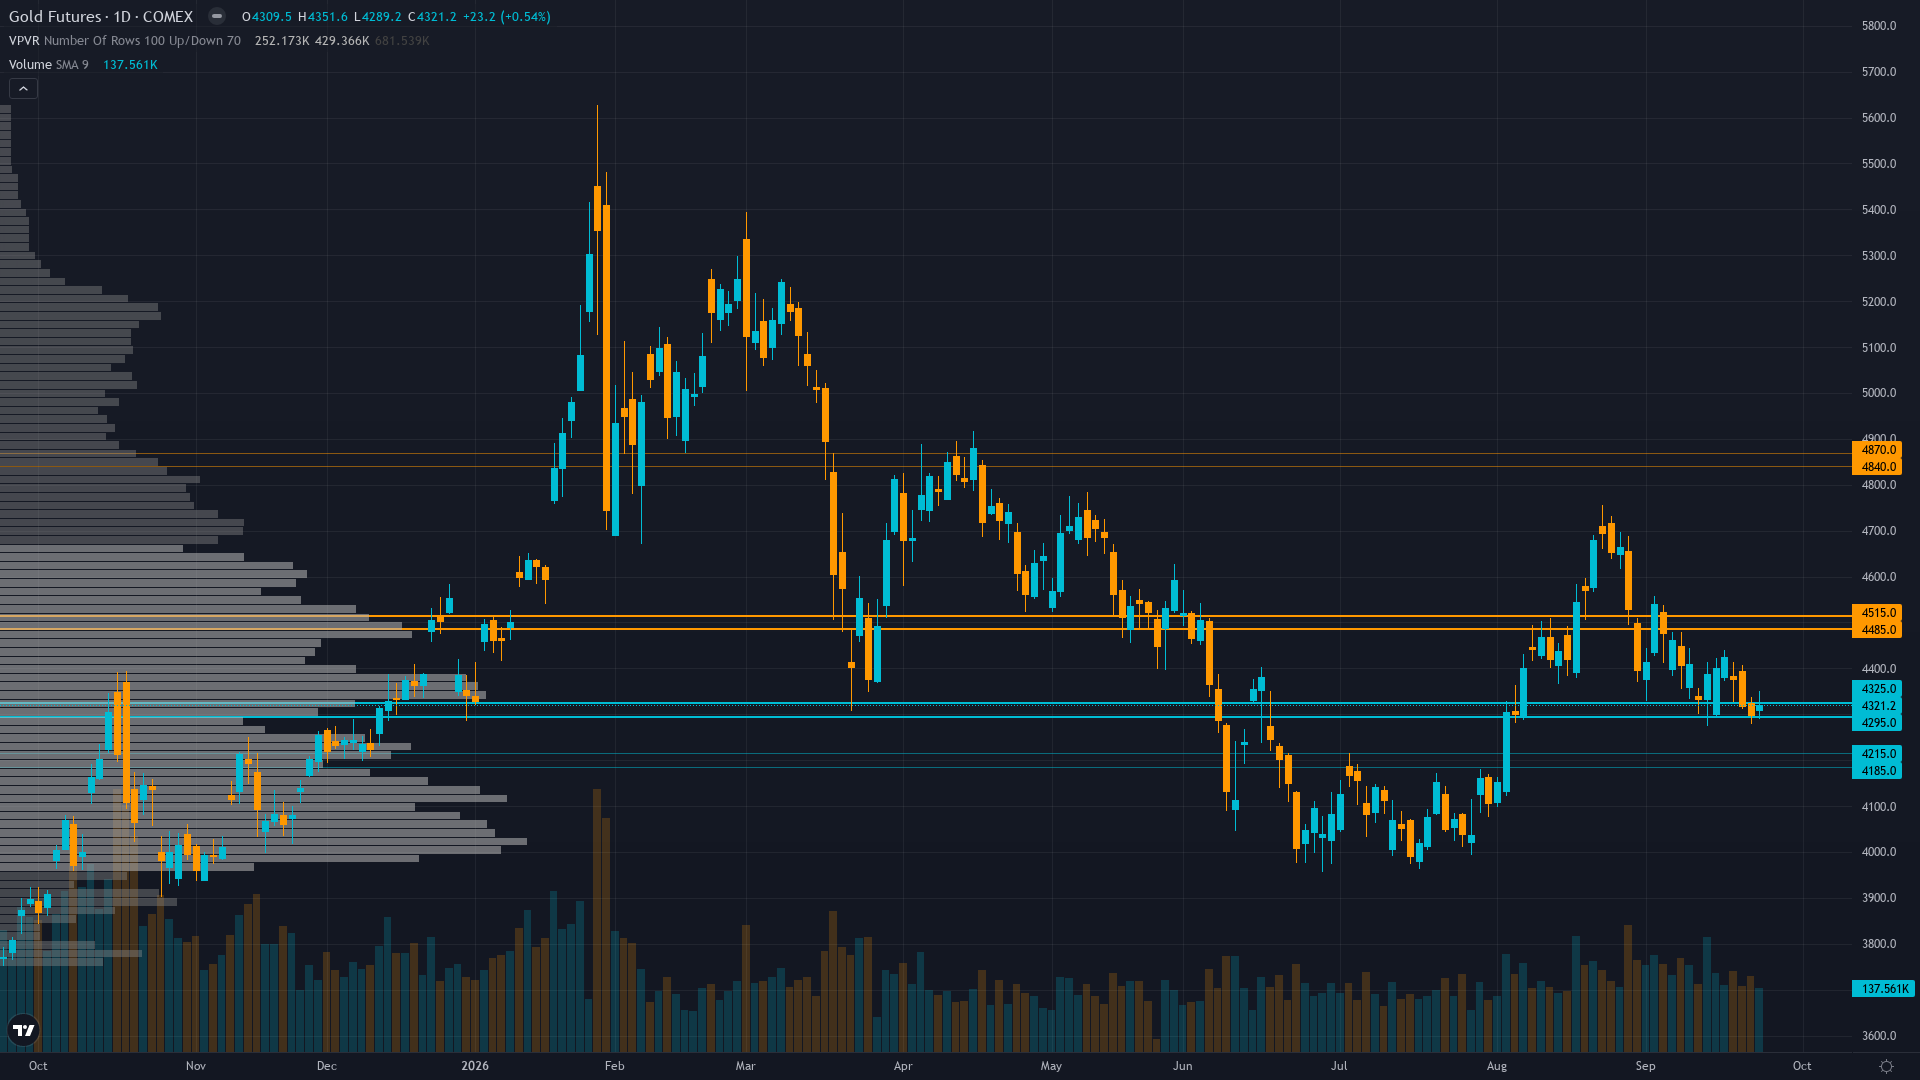
At 4424.9, gold has inched 0.57% higher in a measured advance. The market in gold futures is coiling, with narrowing price ranges suggesting stored energy that will eventually release.
Split between structural bulls (central bank buying, seasonality, institutional year-end targets $4,500-$6,000) and tactical bears (hawkish Fed, 5%+ yields, technical downtrend below 200-day MA) — with no clear prevailing direction after gold rallied through the Sep 16 rate hike
Key Drivers This Week
Primary driver: Post-FOMC digestion: The Fed's unanimous 25bp rate hike on Sep 16 to 3.75%-4.00% (first since 2023) with 16 of 18 officials signaling further tightening was the week's defining catalyst, yet gold rallied +1.16% through the decision, closing at $4,416.70 Dec futures, marking its first weekly gain after three consecutive weekly declines and suggesting the bearish thesis may be exhausting itself
Secondary factor: September seasonal tailwind (+2.1% average historically, 64% positive years) combined with Indian festival season demand building toward Diwali/Dhanteras provides multi-week structural physical demand support that is masked by the macro noise of the rate hike cycle and elevated 10Y yields at 5.01%
Additional influence: Fundamental undervaluation thesis remains intact: spot gold at $4,424.90 trades 5-8% below Goldman Sachs $4,650 near-term fair value estimate and significantly below JPMorgan's $6,000 year-end target, while record Q2 central bank buying of 289 tonnes (+62% YoY) and China's 21-month PBOC buying streak provide a structural demand floor that has fundamentally broken the traditional real yield model
Economic backdrop: TRANSITIONAL macro regime: Fed hiked 25bp to 3.75%-4.00% on Sep 16 with 16/18 officials projecting further tightening; 10Y Treasury at 5.01% (+5bp weekly), 2s10s curve at +25bp; inflation at 2.33% (Aug) remains above target; unemployment at 4.1%; VIX at 16.34 in normal range signaling no equity stress; key catalysts ahead include Fed speeches (Goolsbee, Williams, Jefferson, Barkin Sep 21-22) and S&P Global PMI data (Sep 23)
Fundamental assessment: Gold appears 5-8% undervalued at current levels relative to Goldman Sachs $4,650 fair value; record Q2 central bank buying (289t, +62% YoY) and structural mine supply constraints (1% annual growth) provide a rising floor; the primary risk is sustained 10Y real yields above 2.5% which could temporarily reassert the traditional negative relationship with gold prices, though this model has been structurally broken since 2024
Price Structure
Price at $4,424.90 remains below 200-day MA (~$4,638) in a corrective downtrend from January's $5,318 ATH; RSI near 56 in neutral territory with no overbought/oversold extremes; the key development is that gold held above $4,310 intraweek post-FOMC and recovered to close near weekly highs, a constructive reversal pattern within the broader downtrend
Trend strength registers just 3/10, which typically corresponds to choppy, directionless price action.
Volatility Regime
Volatility for gold price is at the 55th percentile over 90 days — a normal regime that allows for standard position sizing and conventional trade management. The vol trend is down, with contraction across timeframes creating the kind of coiled conditions that historically resolve explosively.
Normal volatility at the 55th percentile supports 1.2-1.8% daily ranges — the $4,310-$4,500 zone provides actionable support and resistance with reasonable reliability; false signal risk is elevated in this low-volatility consolidation as the market lacks a dominant catalyst to drive directional conviction
Bull & Bear Case
Primary risk: Further hawkish Fed rhetoric from the Sep 21-22 Fed speaker slate (Goolsbee, Williams, Jefferson, Barkin) confirming the Sep 16 dot plot's signal of additional tightening, driving 10Y yields toward 5.15%+ and reasserting real yield pressure on gold that could break the $4,310 post-FOMC low toward $4,200 major support (Probability: medium)
Primary opportunity: Gold's resilience through the Sep 16 Fed hike (+1.16% weekly gain despite the most hawkish FOMC outcome) may signal the 'sell the rumor, buy the fact' dynamic has exhausted the bearish repricing, creating a base for a seasonal rally toward $4,500-$4,600 as September-October physical demand (Indian wedding season) combines with structural central bank buying to lift prices (Timeframe: Next 2-4 weeks through the Sep 23 PMI data, late-September Fed speaker commentary, and into early October as Indian festival season (Dhanteras/Diwali) builds physical demand and Q3 central bank buying data is released by the World Gold Council)
This week's edge: Below noise threshold and min signal — discipline signals are evenly split 3-3 between bullish and bearish with the most reliable measured voices (Sentiment 57%, Options 54%) leaning bullish but not strongly enough to overcome the higher-weighted bearish disciplines; the pressing question is whether the Sep 16 rate hike was 'the last hawkish shoe to drop' for the gold bear case given gold's constructive +1.16% response — this is a legitimate thesis but requires at least one more week of confirming price action (per PRECIOUS_METAL behavioural override) before conviction can rise above the 5 minimum threshold for a directional call
Week Ahead Outlook
Fed Goolsbee Speech and Chicago Fed National Activity Index (Aug) — first post-FOMC Fed commentary providing insight into whether the hawkish dot plot projection (16/18 favoring more hikes) represents consensus or was driven by a hawkish minority on Monday 21 September is the next scheduled catalyst, with moderate potential to influence near-term price action.
For GC futures, the balance between existing momentum and scheduled risk events sets the stage for the week ahead.
This analysis covers one dimension. Our full weekly report combines six specialist agents into a single actionable briefing with directional bias, key levels, and risk-opportunity matrix.
Start Free — Get the Market of the WeekFree weekly report · No credit card · Upgrade anytime