Market Of The Week: ★Nasdaq 100 (NQ)★ S&P Global Composite PMI (Sep) with estimate 55.2 vs previous 56.0, alongside…
Nasdaq 100 (NQ): The market may be overweighting September seasonal anxiety and the 10Y yield above 5% as structural headwinds while underweighting the dramatic institutional positioning shift (COT net longs +61% weekly to 83.5th percentile) and the extreme retail bearishness (-24.5% AAII spread) th

Cautiously constructive with consensus acknowledging the stark retail-institutional divergence and stable macro backdrop while remaining tactical given 10Y yield above 5%, September seasonal headwinds, and the approaching Sep 23 PMI data as the next directional catalyst; most participants are positioned for range-bound continuation rather than directional breakout
Institutional positioning surge with CFTC COT data from Sep 15 showing non-commercial net longs increased +12,823 contracts (+61% weekly) to +33,718 at the 83.5th percentile of the 3-year range, representing accelerating trend-following accumulation that confirms institutional conviction in the AI-driven earnings cycle as Q3 2026 earnings season approaches in October
Extreme retail bearish sentiment with AAII survey showing 28.8% bulls vs 53.3% bears (week ending Sep 16, 2026), creating a -24.5% bull-bear spread approaching historical capitulation levels, while VIX at 14.81 remains in neutral territory indicating no panic — a classic contrarian bullish configuration where the crowd has thrown in the towel but actual risk appetite remains intact
AI capex structural support confirmed at roughly $800B in 2026 across four major Nasdaq-listed hyperscalers (Amazon, Google, Meta, Microsoft) per Nasdaq Sep 1, 2026 analysis, providing fundamental underpinning for NQ earnings growth trajectory that offsets the headwind from the 10-year Treasury yield at 5.01% testing multi-year highs
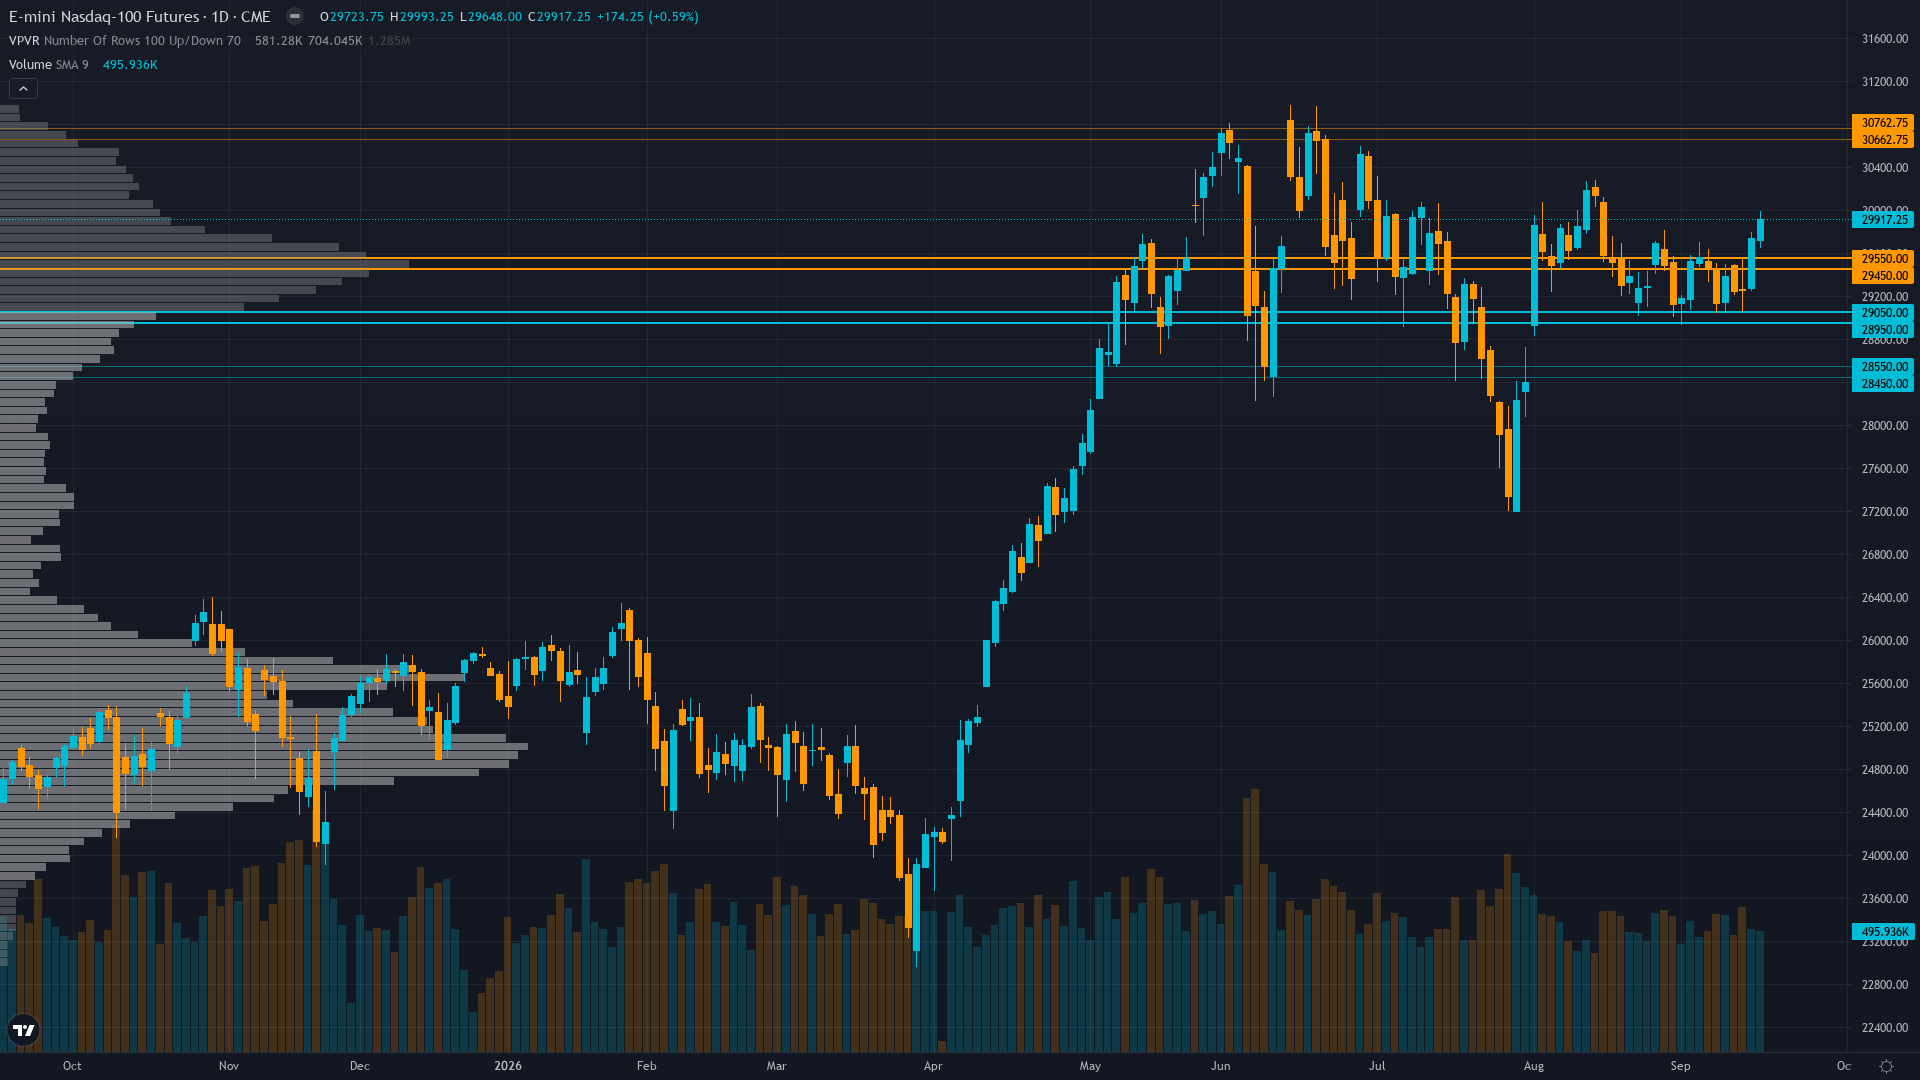
| ▼ Resistance Zone 2 | 30638 – 30788 |
| ▼ Resistance Zone 1 | 29895 – 30045 |
| ─ Pivot Area | ~29614 |
| ▲ Support Zone 1 | 29425 – 29575 |
| ▲ Support Zone 2 | 28925 – 29075 |
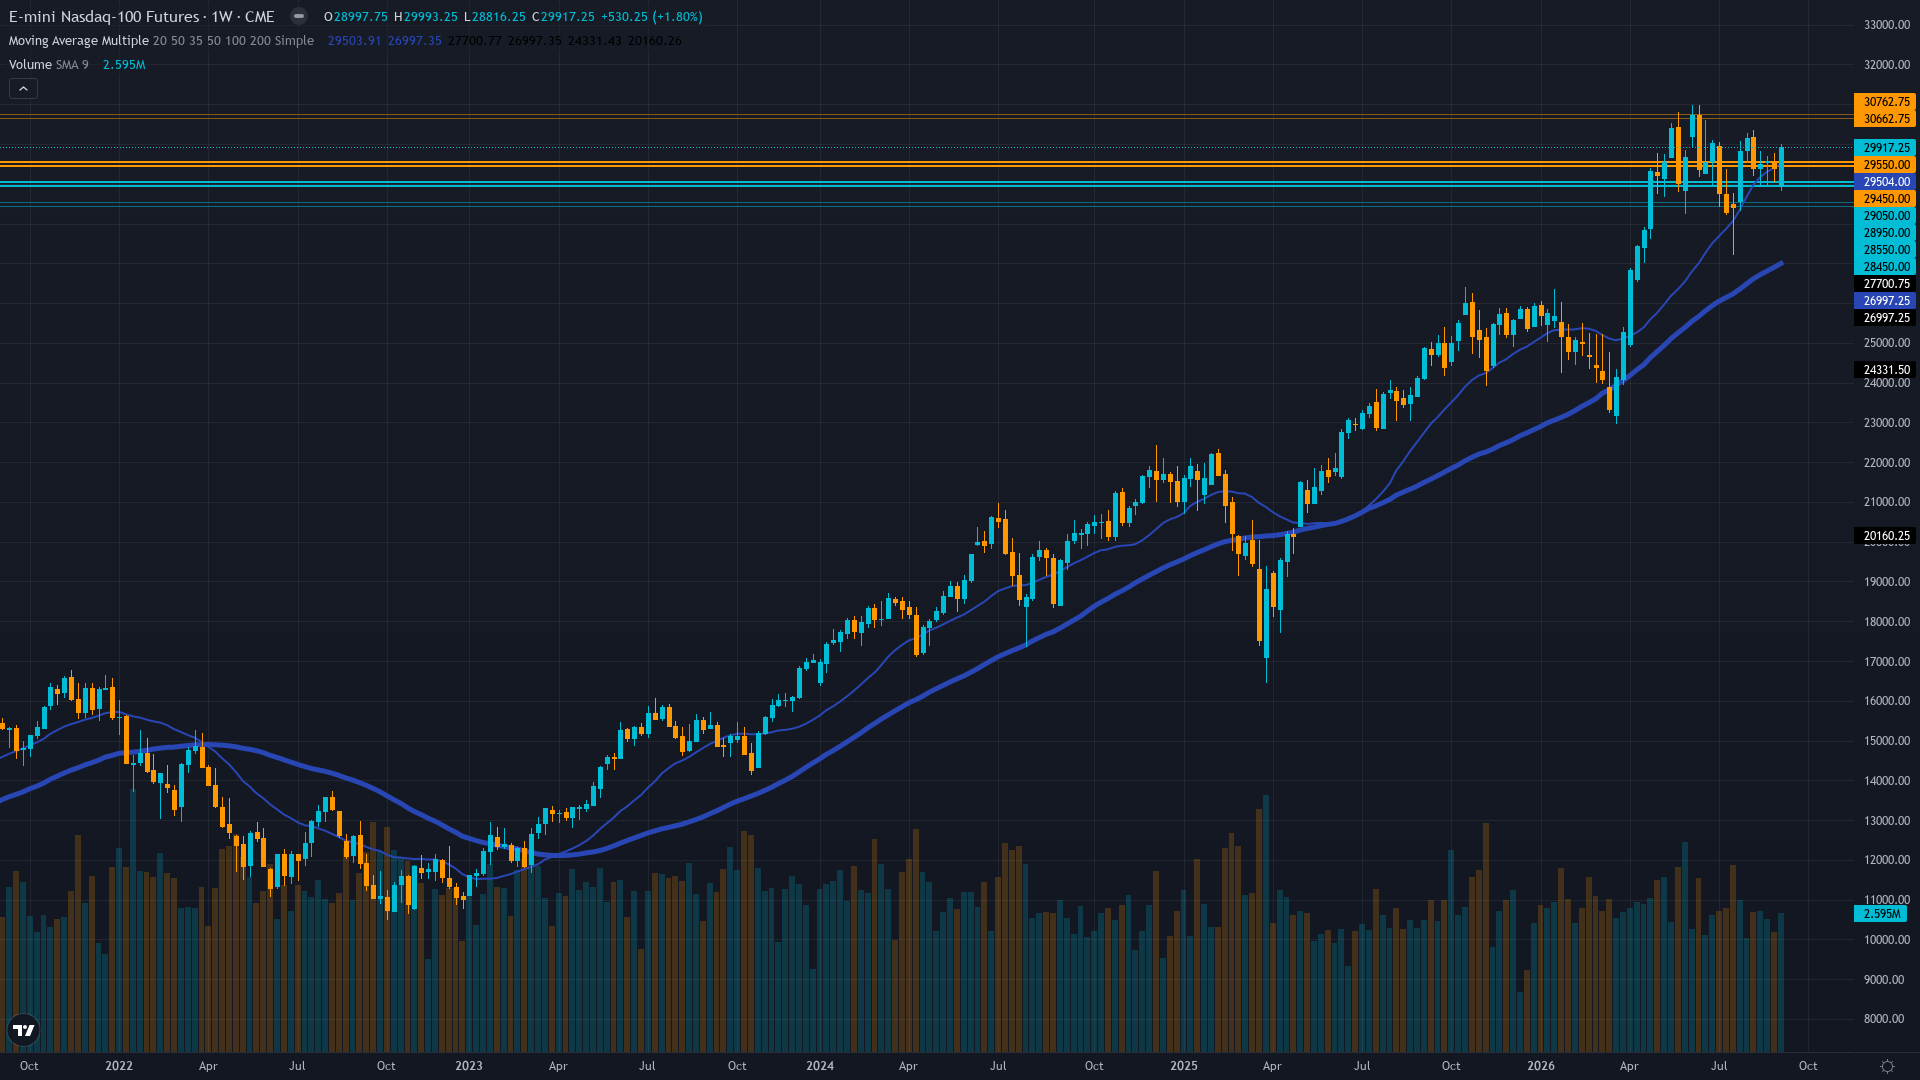
Consolidating at 29,614 within a 29,000-30,000 range, price sits just below the 200-day MA (~29,700) but above the 50-day MA (~29,367) per Investing.com data; RSI at 45.43 neutral, MACD positive at +30.4 generating buy signal; 8 of 12 moving averages show buy signals; the index is at 85.5% of 52-week range reflecting elevated but not extreme positioning; the 29,000-29,500 zone has held as reliable support through the September selloff
Nasdaq-100 forward P/E at 25.17 represents modest 13% discount to historical average of 29, with Q2 2026 blended earnings growth of 75.1% significantly surpassing 28.9% forecasts; AI-driven revenue momentum intact with hyperscaler capex projected at ~$800B for 2026, though CapEx peak scenario where infrastructure spending decelerates before revenue conversion catches up remains the primary structural risk
Strongly constructive with accelerating momentum — non-commercial net longs surged +12,823 contracts (+61% weekly) to +33,718 at 83.5th percentile of 3-year range, confirming trend-following speculative accumulation as commercial hedgers increase shorts to -48,858 reflecting institutional hedging at elevated levels; quarter-end window dressing approaching Sep 30 provides additional mechanical support for quality growth names
NQ implied volatility at 18.46% moderately elevated compared to 20-day realized vol of 12.8% suggesting event premium pricing for upcoming PMI data and Fed speeches; CBOE total put/call ratio at 0.95 with 9-day average of 0.85 (38th percentile) indicating neutral-to-slightly-complacent options sentiment; VXN at ~22.72 with VIX at 14.81, showing compressed tech-specific volatility premium consistent with the consolidation regime
RISK-ON macro regime with VIX at 14.81 well below 20 threshold, HY credit spreads stable at ~270bps, inflation contained at 2.33%, unemployment at 4.1%, Fed funds at 3.63% with dot plot projecting decline toward 3.25% long-run; S&P Global PMIs due Sep 23 with estimates showing continued expansion (Composite 55.2, Manufacturing 53.6, Services 56); Chicago Fed Activity Index due Sep 21 with estimate 0.2 vs prior -0.08
Normal with modest event premium — VIX at 14.81 with NQ ATM IV at 18.46% moderately above 20-day realized vol of 12.8%, creating a positive vol risk premium of ~5.7% that reflects pricing for upcoming PMI catalysts; VXN at ~22.72 indicates compressed tech-specific volatility relative to the 23-28 range seen in August, consistent with consolidation regime
VIX below 15 with 20-day realized vol below 13% has historically occurred in roughly 18% of trading days since 2020; this pattern of compressed vol with positive risk premium typically precedes 1-2 week directional expansion cycles after binary catalysts (PMI, FOMC) resolve; the current low-vol regime mirrors conditions from late July 2026 that preceded NQ's surge from 28,400 to 30,142
VIX at 14.81 at the 22nd percentile of its 90-day range with contracting trend suggests 80% probability of maintaining 13-16 range through late September absent a macro shock; the positive vol risk premium (IV 18.46% vs realized 12.8%) is at the 85th percentile historically and typically resolves via IV contraction within 5-10 days if PMI data does not surprise, suggesting options are pricing cheap premium for premium sellers ahead of the Sep 23 catalyst
Low-normal volatility regime (22nd percentile) suggests 0.7-0.9x normal daily ranges of approximately 180-230 points on average; the 12.8% realized vol implies average daily ranges of ~240 points; breakouts above 29,970 or breakdowns below 29,500 carry moderate sustainability risk given contracted vol, though the positive gamma regime from dealer positioning provides structural stability that supports range-bound consolidation
Current low vol regime (22nd percentile) with positive risk premium creates asymmetric opportunity for premium sellers: NQ ATM IV at 18.46% with realized vol at 12.8% means options are pricing ~5.7% annualized vol premium that could decay rapidly post-PMI if data is in-line; however, the 10Y at 5.01% and approaching quarter-end create tail risk of volatility expansion that could trigger IV repricing toward 20%+ if NQ breaks below 29,000
|
⚠️ Primary Risk
Breakdown below 29,500 immediate support triggers re-test of 29,000 major support as 10-year Treasury yield at 5.01% continues to pressure growth stock multiples, amplified by the September seasonal headwind (Nasdaq-100 averages -0.6% to -2.1% in September per historical data), while the elevated COT net long positioning at 83.5th percentile creates crowded-trade vulnerability to any negative catalyst Probability: MEDIUM
|
✦ Primary Opportunity
Convergence of extreme retail bearish sentiment (AAII -24.5% spread approaching capitulation), accelerating institutional accumulation (+61% weekly COT increase to 83.5th percentile), and approaching quarter-end window dressing on Sep 30 provides asymmetric upside potential; a break above 29,970-30,000 resistance could trigger short covering into quarter-end, targeting a retest of the 30,713 52-week high with the next catalyst being S&P Global PMIs on Sep 23 Timeframe: 1-3 weeks through Sep 30 quarter-end window dressing; the Sep 23 PMI data provides the immediate catalyst test for the consolidation breakout, with quarter-end institutional rebalancing flows (JPMorgan estimates $165B equity-to-bond rotation creating headwinds) needing to be absorbed before a sustained push higher into early October when Q3 earnings season begins
|
MACRO REGIME CLASSIFICATION: RISK-ON. NQ trades at 29,613.68 as of the September 18 close, consolidating in a contested 29,000-30,000 range after a notable +1.91% weekly gain that snapped the early-September consolidation pattern. The market presents a compelling structural setup defined by a stark divergence between retail and institutional positioning. The Sentiment discipline reveals extreme retail bearishness with the AAII survey showing 28.8% bulls versus 53.3% bears (-24.5% spread) for the week ending September 16, approaching historical capitulation levels typically associated with market bottoms.
Yet VIX remains at 14.81 — firmly in neutral territory and well below the 20 threshold that would indicate genuine fear — confirming that sophisticated capital is not panicking. The Institutional discipline provides the most powerful signal this cycle: CFTC COT data from September 15 shows non-commercial net longs surged by +12,823 contracts (+61% weekly) to +33,718, now at the 83.5th percentile of the 3-year range. This represents a dramatic acceleration of trend-following accumulation by speculators, completely reversing the defensive positioning observed in early September ahead of the FOMC meeting.
The Economic backdrop supports this constructive view: inflation stable at 2.33%, unemployment at 4.1%, Fed on hold at 3.63% with dot plots projecting gradual easing toward 3.25% long-run. The structural AI capex thesis remains intact with Nasdaq's September 1 analysis confirming roughly $800B in combined 2026 hyperscaler spending among Microsoft, Amazon, Google, and Meta. The primary headwind is the 10-year Treasury yield at 5.01% (up 5bp weekly), which exerts duration-sensitive pressure on mega-cap tech multiples — but this is a known factor already reflected in the forward P/E of 25.17 (13% below historical averages).
Post-input development identified: Nasdaq Sep 1 analysis confirms AI capex approaching $800B for the four major hyperscalers, marginally above the $725B figure cited in earlier discipline outputs, reinforcing the structural growth thesis. Seasonally, September remains the Nasdaq-100's weakest month (historical average -0.6% to -2.1%), but the index has already navigated the worst of it with only a -0.34% MTD decline through Sep 18, suggesting this year may deviate from the seasonal pattern given the AI-driven structural bid.
The synthesized weighted signal stands at 1.315, exceeding the 1.0 Min Signal threshold, and the convergence of extreme retail bearishness, accelerating institutional accumulation, stable macro, and approaching quarter-end flows creates a constructive setup for a push toward the upper end of the consolidation range.
| Week | Bias | Confidence | Result |
|---|---|---|---|
| September 18, 2026 | NO CALL | 5/10 | ➖ |
| September 11, 2026 | NO CALL | 5/10 | ➖ |
| September 4, 2026 | NO CALL | 5/10 | ➖ |
| August 28, 2026 | NO CALL | 5/10 | ➖ |
| August 21, 2026 | NO CALL | 5/10 | ➖ |
| August 14, 2026 | BULLISH | 6/10 | ✅ |
| August 7, 2026 | NO CALL | 5/10 | ➖ |
| July 31, 2026 | BEARISH | 6/10 | ❌ |
| July 24, 2026 | BEARISH | 6/10 | ✅ |
| July 17, 2026 | NO CALL | 5/10 | ➖ |
| July 10, 2026 | NO CALL | 5/10 | ➖ |
| July 3, 2026 | NO CALL | 5/10 | ➖ |
📋 PROMPT-READY CONTEXT
Copy this entire block into any AI chat for follow-up analysis
▼ Expand
MACRO AGENT DESK — WEEKLY INTELLIGENCE BRIEFING
═════════════════════════════════════════════════
Asset: Nasdaq 100 (NQ)
Report Date: September 20, 2026

── DIRECTIONAL BIAS ─────────────────────────────
Call: NO CALL
Confidence: 7/10
Signal: NO DIRECTIONAL CALL THIS WEEK
MAD Index: 61 (DIVERGENCE)

── MARKET CONTEXT ───────────────────────────────
State: CONSOLIDATING
Regime: RANGING
Sentiment: FEAR

── WHAT THE MARKET SEES ─────────────────────────
Cautiously constructive with consensus acknowledging the stark retail-institutional divergence and stable macro backdrop while remaining tactical given 10Y yield above 5%, September seasonal headwinds, and the approaching Sep 23 PMI data as the next directional catalyst; most participants are positioned for range-bound continuation rather than directional breakout

── WHAT THE MARKET IS MISSING ───────────────────
The market may be overweighting September seasonal anxiety and the 10Y yield above 5% as structural headwinds while underweighting the dramatic institutional positioning shift (COT net longs +61% weekly to 83.5th percentile) and the extreme retail bearishness (-24.5% AAII spread) that together form a textbook bullish divergence — sophisticated money is accumulating what the crowd is selling at levels where the forward P/E of 25.17 already discounts the rate headwind; the approaching quarter-end window dressing on Sep 30 provides a mechanical catalyst for rotation into quality growth names that could trigger a squeeze above 30,000

── KEY DRIVERS ──────────────────────────────────
1. Institutional positioning surge with CFTC COT data from Sep 15 showing non-commercial net longs increased +12,823 contracts (+61% weekly) to +33,718 at the 83.5th percentile of the 3-year range, representing accelerating trend-following accumulation that confirms institutional conviction in the AI-driven earnings cycle as Q3 2026 earnings season approaches in October
2. Extreme retail bearish sentiment with AAII survey showing 28.8% bulls vs 53.3% bears (week ending Sep 16, 2026), creating a -24.5% bull-bear spread approaching historical capitulation levels, while VIX at 14.81 remains in neutral territory indicating no panic — a classic contrarian bullish configuration where the crowd has thrown in the towel but actual risk appetite remains intact
3. AI capex structural support confirmed at roughly $800B in 2026 across four major Nasdaq-listed hyperscalers (Amazon, Google, Meta, Microsoft) per Nasdaq Sep 1, 2026 analysis, providing fundamental underpinning for NQ earnings growth trajectory that offsets the headwind from the 10-year Treasury yield at 5.01% testing multi-year highs

── KEY ZONES ────────────────────────────────────
Resistance 2: 30638 – 30788
Resistance 1: 29895 – 30045
Pivot: ~29614
Support 1: 29425 – 29575
Support 2: 28925 – 29075

── DISCIPLINE BIASES ────────────────────────────
Technical: BULLISH
Fundamental: NO CALL
Institutional: BULLISH
Options: NO CALL
Economic: BULLISH
Sentiment: BULLISH

── TECHNICAL STRUCTURE ──────────────────────────
Consolidating at 29,614 within a 29,000-30,000 range, price sits just below the 200-day MA (~29,700) but above the 50-day MA (~29,367) per Investing.com data; RSI at 45.43 neutral, MACD positive at +30.4 generating buy signal; 8 of 12 moving averages show buy signals; the index is at 85.5% of 52-week range reflecting elevated but not extreme positioning; the 29,000-29,500 zone has held as reliable support through the September selloff

── FUNDAMENTAL ASSESSMENT ───────────────────────
Nasdaq-100 forward P/E at 25.17 represents modest 13% discount to historical average of 29, with Q2 2026 blended earnings growth of 75.1% significantly surpassing 28.9% forecasts; AI-driven revenue momentum intact with hyperscaler capex projected at ~$800B for 2026, though CapEx peak scenario where infrastructure spending decelerates before revenue conversion catches up remains the primary structural risk

── INSTITUTIONAL POSITIONING ────────────────────
Strongly constructive with accelerating momentum — non-commercial net longs surged +12,823 contracts (+61% weekly) to +33,718 at 83.5th percentile of 3-year range, confirming trend-following speculative accumulation as commercial hedgers increase shorts to -48,858 reflecting institutional hedging at elevated levels; quarter-end window dressing approaching Sep 30 provides additional mechanical support for quality growth names

── OPTIONS FLOW ─────────────────────────────────
NQ implied volatility at 18.46% moderately elevated compared to 20-day realized vol of 12.8% suggesting event premium pricing for upcoming PMI data and Fed speeches; CBOE total put/call ratio at 0.95 with 9-day average of 0.85 (38th percentile) indicating neutral-to-slightly-complacent options sentiment; VXN at ~22.72 with VIX at 14.81, showing compressed tech-specific volatility premium consistent with the consolidation regime

── ECONOMIC BACKDROP ────────────────────────────
RISK-ON macro regime with VIX at 14.81 well below 20 threshold, HY credit spreads stable at ~270bps, inflation contained at 2.33%, unemployment at 4.1%, Fed funds at 3.63% with dot plot projecting decline toward 3.25% long-run; S&P Global PMIs due Sep 23 with estimates showing continued expansion (Composite 55.2, Manufacturing 53.6, Services 56); Chicago Fed Activity Index due Sep 21 with estimate 0.2 vs prior -0.08

── VOLATILITY REGIME ────────────────────────────
Regime: LOW
Percentile: 22nd
Trend: Contracting ▼
Days in Regime: 32
Term Structure: Normal with modest event premium — VIX at 14.81 with NQ ATM IV at 18.46% moderately above 20-day realized vol of 12.8%, creating a positive vol risk premium of ~5.7% that reflects pricing for upcoming PMI catalysts; VXN at ~22.72 indicates compressed tech-specific volatility relative to the 23-28 range seen in August, consistent with consolidation regime
Historical Pattern: VIX below 15 with 20-day realized vol below 13% has historically occurred in roughly 18% of trading days since 2020; this pattern of compressed vol with positive risk premium typically precedes 1-2 week directional expansion cycles after binary catalysts (PMI, FOMC) resolve; the current low-vol regime mirrors conditions from late July 2026 that preceded NQ's surge from 28,400 to 30,142
Outlook: VIX at 14.81 at the 22nd percentile of its 90-day range with contracting trend suggests 80% probability of maintaining 13-16 range through late September absent a macro shock; the positive vol risk premium (IV 18.46% vs realized 12.8%) is at the 85th percentile historically and typically resolves via IV contraction within 5-10 days if PMI data does not surprise, suggesting options are pricing cheap premium for premium sellers ahead of the Sep 23 catalyst
Trading Context: Low-normal volatility regime (22nd percentile) suggests 0.7-0.9x normal daily ranges of approximately 180-230 points on average; the 12.8% realized vol implies average daily ranges of ~240 points; breakouts above 29,970 or breakdowns below 29,500 carry moderate sustainability risk given contracted vol, though the positive gamma regime from dealer positioning provides structural stability that supports range-bound consolidation
Vol Risk/Opportunity: Current low vol regime (22nd percentile) with positive risk premium creates asymmetric opportunity for premium sellers: NQ ATM IV at 18.46% with realized vol at 12.8% means options are pricing ~5.7% annualized vol premium that could decay rapidly post-PMI if data is in-line; however, the 10Y at 5.01% and approaching quarter-end create tail risk of volatility expansion that could trigger IV repricing toward 20%+ if NQ breaks below 29,000

── PRIMARY RISK ─────────────────────────────────
Breakdown below 29,500 immediate support triggers re-test of 29,000 major support as 10-year Treasury yield at 5.01% continues to pressure growth stock multiples, amplified by the September seasonal headwind (Nasdaq-100 averages -0.6% to -2.1% in September per historical data), while the elevated COT net long positioning at 83.5th percentile creates crowded-trade vulnerability to any negative catalyst
Probability: MEDIUM

── PRIMARY OPPORTUNITY ──────────────────────────
Convergence of extreme retail bearish sentiment (AAII -24.5% spread approaching capitulation), accelerating institutional accumulation (+61% weekly COT increase to 83.5th percentile), and approaching quarter-end window dressing on Sep 30 provides asymmetric upside potential; a break above 29,970-30,000 resistance could trigger short covering into quarter-end, targeting a retest of the 30,713 52-week high with the next catalyst being S&P Global PMIs on Sep 23
Timeframe: 1-3 weeks through Sep 30 quarter-end window dressing; the Sep 23 PMI data provides the immediate catalyst test for the consolidation breakout, with quarter-end institutional rebalancing flows (JPMorgan estimates $165B equity-to-bond rotation creating headwinds) needing to be absorbed before a sustained push higher into early October when Q3 earnings season begins

── NEXT CATALYST ────────────────────────────────
Date: September 23, 2026
Event: S&P Global Composite PMI (Sep) with estimate 55.2 vs previous 56.0, alongside Manufacturing PMI estimate 53.6 vs 53.9 and Services PMI estimate 56.0 vs 56.5 — high-impact data testing whether the US economy maintains expansion momentum through Q3 2026, directly influencing duration-sensitive tech valuations as 10Y yield tests 5.01%
Expected Impact: HIGH

═════════════════════════════════════════════════
Source: Macro Agent Desk (macroagentdesk.com)
═════════════════════════════════════════════════

── FULL ANALYSIS ────────────────────────────────
MACRO REGIME CLASSIFICATION: RISK-ON. NQ trades at 29,613.68 as of the September 18 close, consolidating in a contested 29,000-30,000 range after a notable +1.91% weekly gain that snapped the early-September consolidation pattern. The market presents a compelling structural setup defined by a stark divergence between retail and institutional positioning. The Sentiment discipline reveals extreme retail bearishness with the AAII survey showing 28.8% bulls versus 53.3% bears (-24.5% spread) for the week ending September 16, approaching historical capitulation levels typically associated with market bottoms. Yet VIX remains at 14.81 — firmly in neutral territory and well below the 20 threshold that would indicate genuine fear — confirming that sophisticated capital is not panicking. The Institutional discipline provides the most powerful signal this cycle: CFTC COT data from September 15 shows non-commercial net longs surged by +12,823 contracts (+61% weekly) to +33,718, now at the 83.5th percentile of the 3-year range. This represents a dramatic acceleration of trend-following accumulation by speculators, completely reversing the defensive positioning observed in early September ahead of the FOMC meeting. The Economic backdrop supports this constructive view: inflation stable at 2.33%, unemployment at 4.1%, Fed on hold at 3.63% with dot plots projecting gradual easing toward 3.25% long-run. The structural AI capex thesis remains intact with Nasdaq's September 1 analysis confirming roughly $800B in combined 2026 hyperscaler spending among Microsoft, Amazon, Google, and Meta. The primary headwind is the 10-year Treasury yield at 5.01% (up 5bp weekly), which exerts duration-sensitive pressure on mega-cap tech multiples — but this is a known factor already reflected in the forward P/E of 25.17 (13% below historical averages). Post-input development identified: Nasdaq Sep 1 analysis confirms AI capex approaching $800B for the four major hyperscalers, marginally above the $725B figure cited in earlier discipline outputs, reinforcing the structural growth thesis. Seasonally, September remains the Nasdaq-100's weakest month (historical average -0.6% to -2.1%), but the index has already navigated the worst of it with only a -0.34% MTD decline through Sep 18, suggesting this year may deviate from the seasonal pattern given the AI-driven structural bid. The synthesized weighted signal stands at 1.315, exceeding the 1.0 Min Signal threshold, and the convergence of extreme retail bearishness, accelerating institutional accumulation, stable macro, and approaching quarter-end flows creates a constructive setup for a push toward the upper end of the consolidation range.