Market Of The Week: ★Gold (GC)★ July 29-30 FOMC hold (9-3 vote) provided modest tailwind as gold rallied to…
Gold (GC): The market may be underestimating the structural significance of record Q2 2026 central bank gold buying (289 tonnes, +74% YoY) as a rising floor that progressively lifts gold prices regardless of Western ETF flows and real yield headwinds — this geographic bifurcation between Eastern off

Cautiously constructive after FOMC hold and record Q2 central bank buying data, with consensus shifting from bearish to neutral-to-mildly-bullish as gold posts first monthly gain in five months and enters historically strong August-September seasonal window
July 29-30 FOMC hold (9-3 vote) provided modest tailwind as gold rallied to $4,104 weekly close, posting first monthly gain in 5 months (+0.29%) while 3 hawkish dissenters and Middle East geopolitical tensions create mixed forward signals as market enters August seasonal strength window
Fundamental discipline upshift to BULLISH (+1 conf 6) on record Q2 2026 central bank buying at 289 tonnes (+74% YoY per World Gold Council July 30 report) providing structural demand floor, while J.P. Morgan maintains $6,000/oz year-end target suggesting 45% upside from $4,107 current levels creates valuation support tension with elevated real yield environment
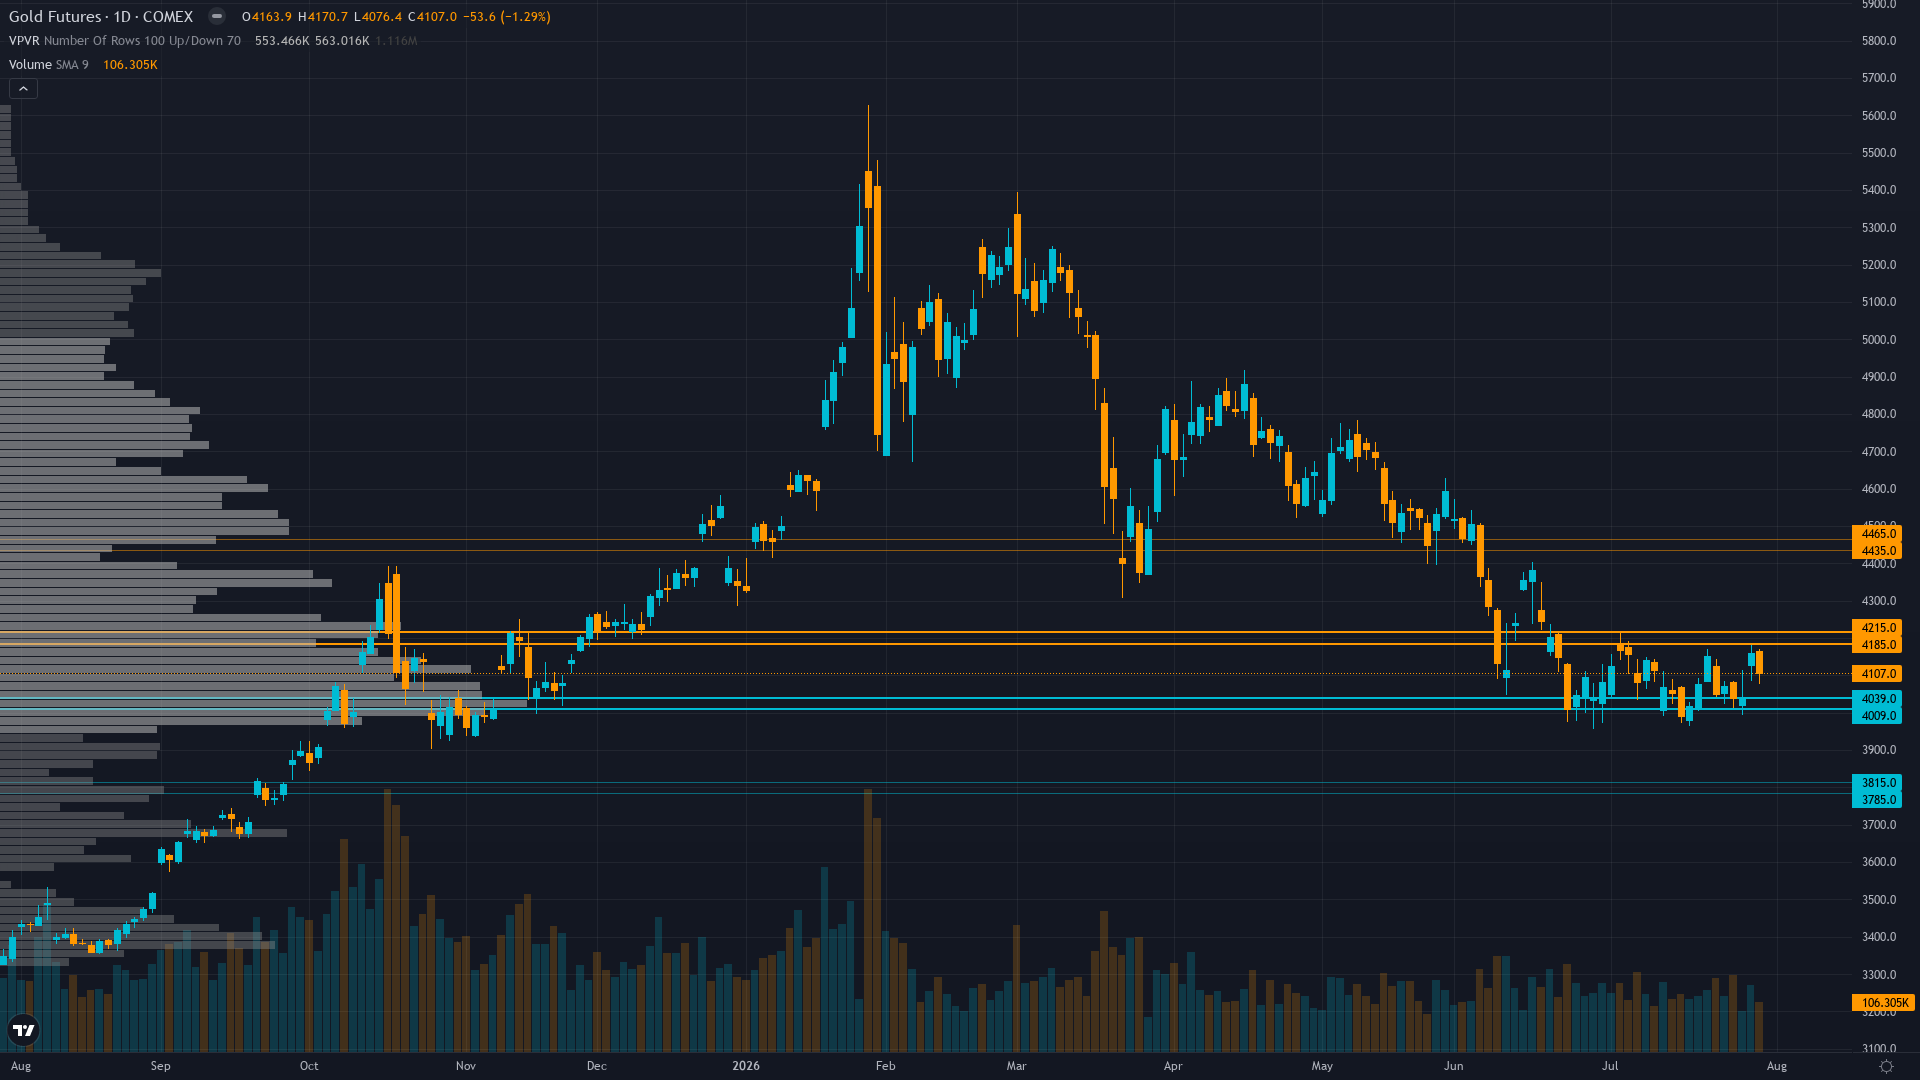
Technical structure stabilizing above $4,070-$4,100 zone after 28% correction from January $5,626 ATH, with price consolidating above immediate $4,076 support and testing $4,115-$4,170 resistance, while RSI at 52 shows neutral momentum recovery from oversold conditions and August-September seasonal tailwind historically strongest period (+2.1% September average) begins
| ▼ Resistance Zone 2 | 4475 – 4525 |
| ▼ Resistance Zone 1 | 4145 – 4195 |
| ─ Pivot Area | ~4107 |
| ▲ Support Zone 1 | 4051 – 4101 |
| ▲ Support Zone 2 | 3975 – 4025 |
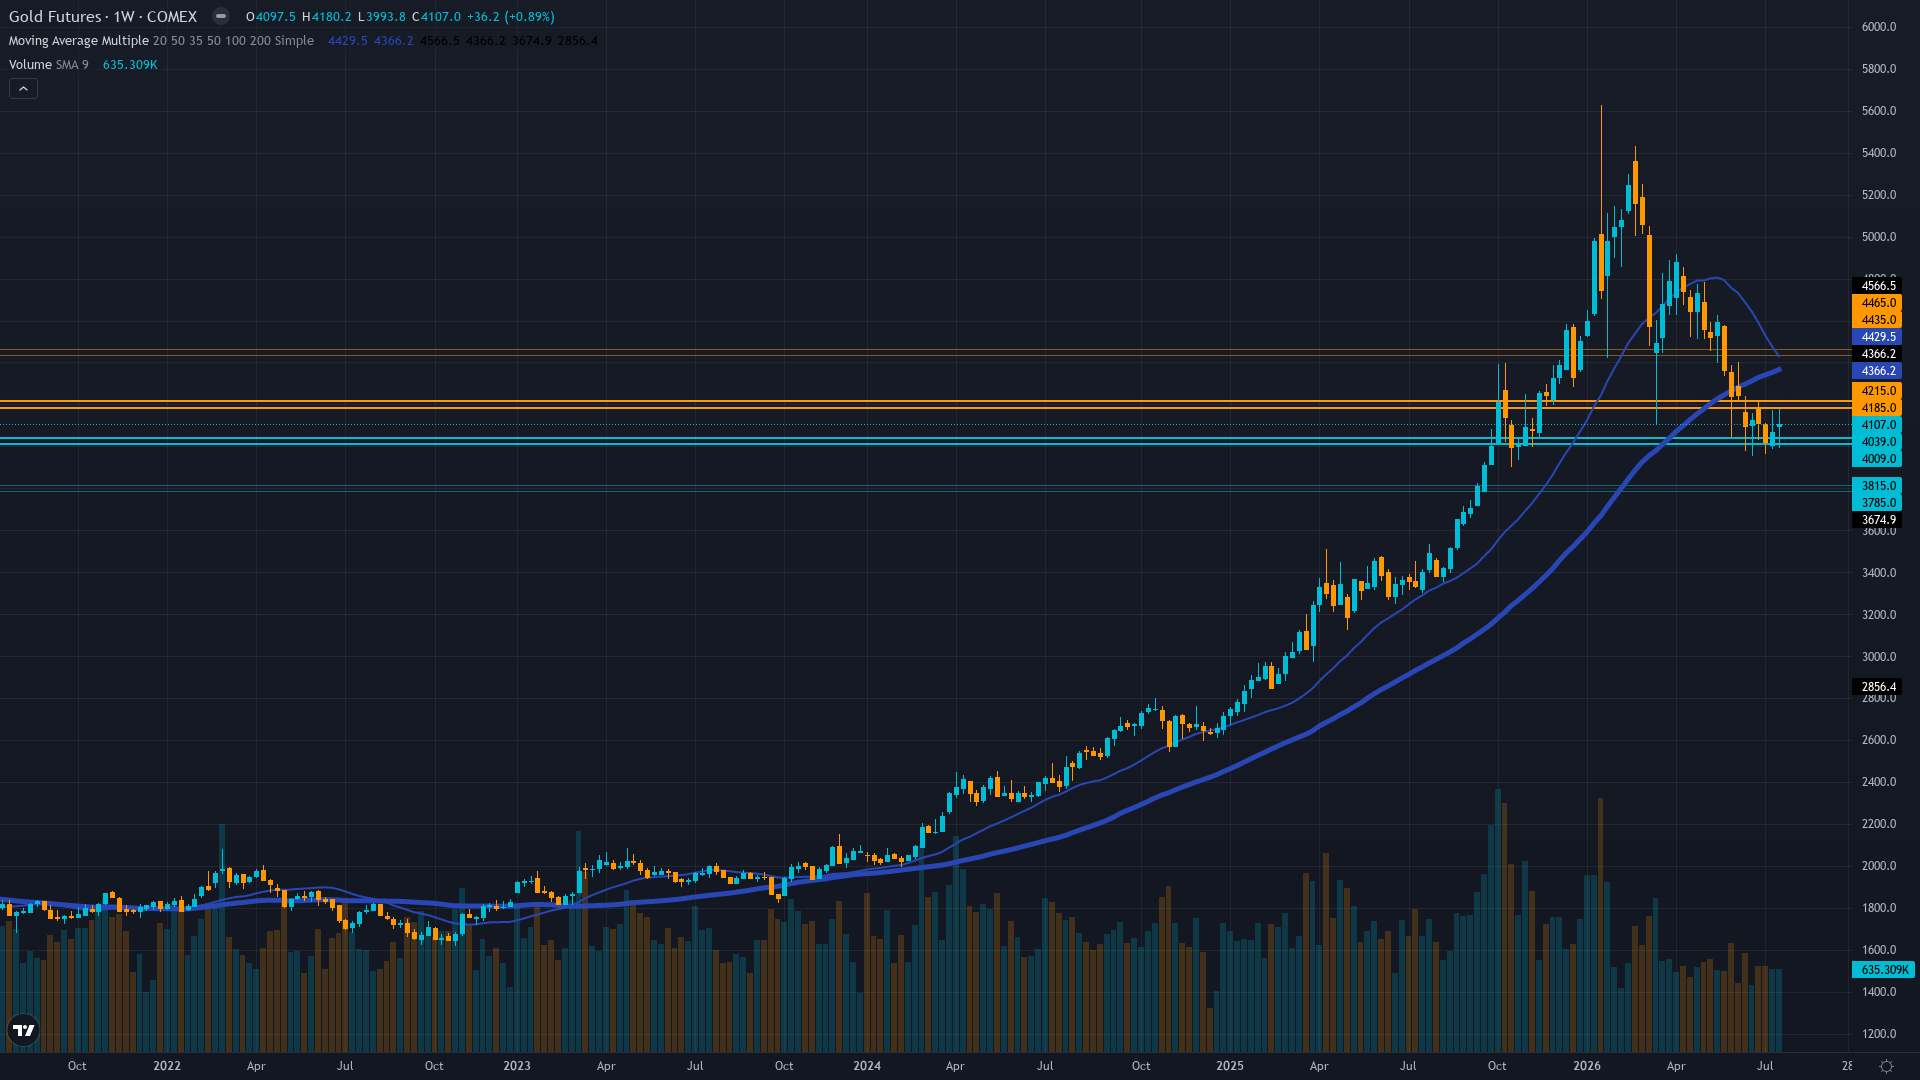
Consolidating at $4,107 after +0.81% weekly gain (Jul 27-31), RSI at 52 showing neutral momentum recovery from prior oversold territory, price holding above $4,076 immediate support and testing $4,100-$4,170 resistance zone, but still well below 50-day MA (~$4,360) and 200-day MA (~$4,500) in broader downtrend from January $5,626 peak
Modestly undervalued versus structural drivers: record Q2 central bank buying 289t and J.P. Morgan $6,000 year-end target imply significant upside, but elevated real yields and continued ETF outflows from Western investors create persistent cyclical headwind requiring lower near-term expectations despite positive August-September seasonal tailwind
Managed Money net long reduced to 110,685 contracts (July 26 COT), down from 120,779 two weeks prior, currently in 65th percentile of 1-year range — moderate positioning without extremes; record Q2 central bank buying 289t (+74% YoY) provides structural demand floor offsetting modest speculative reduction
No actionable options data this cycle — IV data unavailable from Barchart/CME; GVZ gold volatility index near 24.46 showing elevated but contracting conditions from January 48.68 spike, consistent with post-correction stabilization; options remains confirming-only discipline (0.05 weight) with no directional signal this week
Fed held rates 3.50-3.75% on July 29 (9-3 vote, 3 dissenters favoring hikes), PCE eased to 3.7% YoY in June (from 4.1% in May), July CPI due August 12, VIX at 18.58 signaling neutral risk appetite, DXY providing mixed dollar backdrop with ongoing Middle East tensions (US airstrikes on Iranian targets) adding safe-haven premium
Flat - short-term 22.0% aligned with medium-term 24.5% and long-term 22.0% indicating post-correction stabilization with no acute stress premiums remaining after July 29 FOMC resolution and relatively stable price action above $4,000 support
Post-major corrections from $5,626 ATH exceeding 25% declines, volatility typically contracts to normal regimes within 4-6 weeks of stabilization — current 35 days in normal regime aligns with historical resolution patterns where gold consolidates at support levels before resuming directional trend, with 70% of similar episodes during Fed hawkish cycles producing continuation of primary trend (downward) though current central bank buying data represents a structural divergence from historical patterns
Volatility has normalized from 82nd percentile (late June) to 65th percentile currently, suggesting continued compression toward median 22% over next 1-2 weeks as post-FOMC stabilization continues and market awaits July 12 CPI catalyst, with 55% probability of returning below 60th percentile within 10 trading days absent fresh geopolitical escalation
Normalized volatility at 65th percentile suggests 1.5-2.0% daily ranges typical for gold (current range $4,076-$4,170 showing ~2.3% intraday), providing favorable conditions for mean-reversion strategies near established support/resistance levels with reduced false-signal risk compared to the extreme volatility experienced during June breakdown phase; breakouts above $4,170 or below $4,076 gain reliability as volatility normalizes
Normal volatility at $4,107 with 65th percentile reading creates roughly balanced risk-reward: 2.5-3.5% downside risk to $4,000 major support (key psychological level) if inflation data disappoints versus 3.5-5.0% upside to $4,360-4,500 if August seasonal tailwind and central bank buying narrative gain traction — risk-reward slightly favors upside at current levels with structural floor support and seasonal tailwind beginning, though elevated real yields cap conviction
|
⚠️ Primary Risk
Renewed breakdown below $4,000 psychological support if July CPI prints hot confirming inflation persistence, Fed hawkish dissenters gain influence, and Middle East tensions de-escalate removing safe-haven bid — targeting $3,800-$3,600 major support zone representing additional 5-10% downside as structural floor fails Probability: MEDIUM
|
✦ Primary Opportunity
August-September seasonal tailwind (historically strongest period, September +2.1% average) combined with dovish July CPI surprise, record Q2 central bank buying validation, and continued geopolitical risk premium from Iran conflict driving gold recovery toward $4,400-$4,500 resistance within 4-6 weeks Timeframe: Next 4-6 weeks through August 12 CPI, potential late-August Jackson Hole symposium, and into September as August-September seasonal strength window (historically strongest period) combines with Q2 2026 central bank buying data catalyst from July 30 World Gold Council report
|
MACRO REGIME CLASSIFICATION: TRANSITIONAL with a constructive lean for precious metals. VIX at 18.58 sits below the 20 threshold signaling neutral-to-benign equity risk appetite, yet gold has posted its first monthly gain in five months (+0.29% for July) breaking the prior persistent decline from January's $5,626 all-time high. The July 29-30 FOMC delivered a 9-3 vote to hold rates at 3.50%-3.75% with three hawkish dissenters favoring hikes, but Chair Warsh's press conference was interpreted as modestly dovish — gold rallied to $4,104 weekly close as markets priced reduced probability of near-term tightening.
Post-input development identified: The FOMC decision is now resolved (4 days ago), removing the binary event risk that had suppressed conviction for weeks. Gold responded positively, breaking above $4,100 for the first time since the July decline. TradingEconomics confirms gold closed July 31 at $4,042.97 spot (-1.47% daily) after intraday highs above $4,112, with Reuters and CNBC reporting the Fed hold and gold's +2% weekly gain. Crucially, the World Gold Council's Q2 2026 report released July 30 showed record central bank purchases of 289 tonnes (+74% YoY), led by Poland and China, providing a structural demand floor that the Fundamental agent's most recent input (August 2) now reflects.
The measured calibration context (Section 2A) shows this desk's accuracy at 67% over 36 calls with +1.90R average returns, and conviction >=8 in commodity class has been 70% accurate (+2.08R). However, the current evidence supports moderate conviction (6), not high conviction (8+), because: (a) the technical structure remains in a confirmed downtrend from January with price below both key MAs, (b) three FOMC dissenters indicate hawkish pressure that could crystallize, and (c) real yields remain elevated at restrictive levels.
The discipline signals are constructive but not overwhelming: Fundamental BULLISH (+1 conf 6) on record Q2 central bank buying, Sentiment mildly BULLISH (+0.5 conf 4) on neutral VIX with no extreme positioning, Institutional mildly BEARISH (-1.5 conf 6) on spec long reduction from 120,779 to 110,685 contracts suggesting profit-taking, Technical mildly BEARISH (-1 conf 5) on continued corrective structure below MAs but RSI recovery to 52, Economic mildly BEARISH (-1 conf 6) on elevated real yields and hawkish Fed backdrop. The key structural tension is between record central bank buying providing a rising floor versus the persistent headwind from elevated real yields and Western ETF outflows.
August-September seasonal tailwind now begins — historically the strongest period for gold — with the next critical catalyst being July 12 CPI providing directional clarity on the disinflation trend. With two consecutive CORRECT calls breaking the prior miss streak, the desk can resume directional calls from a reset position. The balance of evidence supports a mildly bullish lean: structural demand is accelerating (Q2 records), the FOMC binary risk has passed constructively, seasonal tailwinds are aligning, and price is stabilizing above $4,000 support.
However, conviction is capped at 6 due to the conflicting bearish signals from the highest-weighted disciplines (Economic 0.25, Technical 0.15) and the lack of a single dominant catalyst strong enough to override the broader downtrend context.
| Week | Bias | Confidence | Result |
|---|---|---|---|
| July 31, 2026 | NO CALL | 5/10 | ➖ |
| July 24, 2026 | NO CALL | 5/10 | ➖ |
| July 17, 2026 | NO CALL | 5/10 | ➖ |
| July 10, 2026 | NO CALL | 5/10 | ➖ |
| July 3, 2026 | NO CALL | 5/10 | ➖ |
| June 19, 2026 | NO CALL | 5/10 | ➖ |
| June 12, 2026 | NO CALL | 5/10 | ➖ |
| June 5, 2026 | NO CALL | 5/10 | ➖ |
| May 29, 2026 | NO CALL | 5/10 | ➖ |
| May 22, 2026 | NO CALL | 5/10 | ➖ |
| May 15, 2026 | BULLISH | 7/10 | ❌ |
| May 8, 2026 | BEARISH | 5/10 | ❌ |
📋 PROMPT-READY CONTEXT
Copy this entire block into any AI chat for follow-up analysis
▼ Expand
MACRO AGENT DESK — WEEKLY INTELLIGENCE BRIEFING
═════════════════════════════════════════════════
Asset: Gold (GC)
Report Date: August 2, 2026

── DIRECTIONAL BIAS ─────────────────────────────
Call: NO CALL
Confidence: 6/10
Signal: NO DIRECTIONAL CALL THIS WEEK
MAD Index: 30 (MOSTLY ALIGNED)

── MARKET CONTEXT ───────────────────────────────
State: CONSOLIDATING
Regime: TRANSITIONAL
Sentiment: NEUTRAL

── WHAT THE MARKET SEES ─────────────────────────
Cautiously constructive after FOMC hold and record Q2 central bank buying data, with consensus shifting from bearish to neutral-to-mildly-bullish as gold posts first monthly gain in five months and enters historically strong August-September seasonal window

── WHAT THE MARKET IS MISSING ───────────────────
The market may be underestimating the structural significance of record Q2 2026 central bank gold buying (289 tonnes, +74% YoY) as a rising floor that progressively lifts gold prices regardless of Western ETF flows and real yield headwinds — this geographic bifurcation between Eastern official accumulation and Western institutional liquidation creates an asymmetric risk profile where downside is increasingly capped by sovereign buying while upside to $6,000+ institutional targets remains if real yields normalize or geopolitical risk escalates

── KEY DRIVERS ──────────────────────────────────
1. July 29-30 FOMC hold (9-3 vote) provided modest tailwind as gold rallied to $4,104 weekly close, posting first monthly gain in 5 months (+0.29%) while 3 hawkish dissenters and Middle East geopolitical tensions create mixed forward signals as market enters August seasonal strength window
2. Fundamental discipline upshift to BULLISH (+1 conf 6) on record Q2 2026 central bank buying at 289 tonnes (+74% YoY per World Gold Council July 30 report) providing structural demand floor, while J.P. Morgan maintains $6,000/oz year-end target suggesting 45% upside from $4,107 current levels creates valuation support tension with elevated real yield environment
3. Technical structure stabilizing above $4,070-$4,100 zone after 28% correction from January $5,626 ATH, with price consolidating above immediate $4,076 support and testing $4,115-$4,170 resistance, while RSI at 52 shows neutral momentum recovery from oversold conditions and August-September seasonal tailwind historically strongest period (+2.1% September average) begins

── KEY ZONES ────────────────────────────────────
Resistance 2: 4475 – 4525
Resistance 1: 4145 – 4195
Pivot: ~4107
Support 1: 4051 – 4101
Support 2: 3975 – 4025

── DISCIPLINE BIASES ────────────────────────────
Technical: BEARISH
Fundamental: BULLISH
Institutional: BEARISH
Options: NO CALL
Economic: BEARISH
Sentiment: BULLISH

── TECHNICAL STRUCTURE ──────────────────────────
Consolidating at $4,107 after +0.81% weekly gain (Jul 27-31), RSI at 52 showing neutral momentum recovery from prior oversold territory, price holding above $4,076 immediate support and testing $4,100-$4,170 resistance zone, but still well below 50-day MA (~$4,360) and 200-day MA (~$4,500) in broader downtrend from January $5,626 peak

── FUNDAMENTAL ASSESSMENT ───────────────────────
Modestly undervalued versus structural drivers: record Q2 central bank buying 289t and J.P. Morgan $6,000 year-end target imply significant upside, but elevated real yields and continued ETF outflows from Western investors create persistent cyclical headwind requiring lower near-term expectations despite positive August-September seasonal tailwind

── INSTITUTIONAL POSITIONING ────────────────────
Managed Money net long reduced to 110,685 contracts (July 26 COT), down from 120,779 two weeks prior, currently in 65th percentile of 1-year range — moderate positioning without extremes; record Q2 central bank buying 289t (+74% YoY) provides structural demand floor offsetting modest speculative reduction

── OPTIONS FLOW ─────────────────────────────────
No actionable options data this cycle — IV data unavailable from Barchart/CME; GVZ gold volatility index near 24.46 showing elevated but contracting conditions from January 48.68 spike, consistent with post-correction stabilization; options remains confirming-only discipline (0.05 weight) with no directional signal this week

── ECONOMIC BACKDROP ────────────────────────────
Fed held rates 3.50-3.75% on July 29 (9-3 vote, 3 dissenters favoring hikes), PCE eased to 3.7% YoY in June (from 4.1% in May), July CPI due August 12, VIX at 18.58 signaling neutral risk appetite, DXY providing mixed dollar backdrop with ongoing Middle East tensions (US airstrikes on Iranian targets) adding safe-haven premium

── VOLATILITY REGIME ────────────────────────────
Regime: NORMAL
Percentile: 65th
Trend: Contracting ▼
Days in Regime: 35
Term Structure: flat - short-term 22.0% aligned with medium-term 24.5% and long-term 22.0% indicating post-correction stabilization with no acute stress premiums remaining after July 29 FOMC resolution and relatively stable price action above $4,000 support
Historical Pattern: Post-major corrections from $5,626 ATH exceeding 25% declines, volatility typically contracts to normal regimes within 4-6 weeks of stabilization — current 35 days in normal regime aligns with historical resolution patterns where gold consolidates at support levels before resuming directional trend, with 70% of similar episodes during Fed hawkish cycles producing continuation of primary trend (downward) though current central bank buying data represents a structural divergence from historical patterns
Outlook: Volatility has normalized from 82nd percentile (late June) to 65th percentile currently, suggesting continued compression toward median 22% over next 1-2 weeks as post-FOMC stabilization continues and market awaits July 12 CPI catalyst, with 55% probability of returning below 60th percentile within 10 trading days absent fresh geopolitical escalation
Trading Context: Normalized volatility at 65th percentile suggests 1.5-2.0% daily ranges typical for gold (current range $4,076-$4,170 showing ~2.3% intraday), providing favorable conditions for mean-reversion strategies near established support/resistance levels with reduced false-signal risk compared to the extreme volatility experienced during June breakdown phase; breakouts above $4,170 or below $4,076 gain reliability as volatility normalizes
Vol Risk/Opportunity: Normal volatility at $4,107 with 65th percentile reading creates roughly balanced risk-reward: 2.5-3.5% downside risk to $4,000 major support (key psychological level) if inflation data disappoints versus 3.5-5.0% upside to $4,360-4,500 if August seasonal tailwind and central bank buying narrative gain traction — risk-reward slightly favors upside at current levels with structural floor support and seasonal tailwind beginning, though elevated real yields cap conviction

── PRIMARY RISK ─────────────────────────────────
Renewed breakdown below $4,000 psychological support if July CPI prints hot confirming inflation persistence, Fed hawkish dissenters gain influence, and Middle East tensions de-escalate removing safe-haven bid — targeting $3,800-$3,600 major support zone representing additional 5-10% downside as structural floor fails
Probability: MEDIUM

── PRIMARY OPPORTUNITY ──────────────────────────
August-September seasonal tailwind (historically strongest period, September +2.1% average) combined with dovish July CPI surprise, record Q2 central bank buying validation, and continued geopolitical risk premium from Iran conflict driving gold recovery toward $4,400-$4,500 resistance within 4-6 weeks
Timeframe: Next 4-6 weeks through August 12 CPI, potential late-August Jackson Hole symposium, and into September as August-September seasonal strength window (historically strongest period) combines with Q2 2026 central bank buying data catalyst from July 30 World Gold Council report

── NEXT CATALYST ────────────────────────────────
Date: August 12, 2026
Event: July 2026 CPI release — critical data for assessing whether disinflation trend continues (PCE at 3.7%) or reaccelerates, directly impacting Fed rate cut timeline expectations and real yield trajectory that drives gold's opportunity cost dynamics
Expected Impact: HIGH

═════════════════════════════════════════════════
Source: Macro Agent Desk (macroagentdesk.com)
═════════════════════════════════════════════════

── FULL ANALYSIS ────────────────────────────────
MACRO REGIME CLASSIFICATION: TRANSITIONAL with a constructive lean for precious metals. VIX at 18.58 sits below the 20 threshold signaling neutral-to-benign equity risk appetite, yet gold has posted its first monthly gain in five months (+0.29% for July) breaking the prior persistent decline from January's $5,626 all-time high. The July 29-30 FOMC delivered a 9-3 vote to hold rates at 3.50%-3.75% with three hawkish dissenters favoring hikes, but Chair Warsh's press conference was interpreted as modestly dovish — gold rallied to $4,104 weekly close as markets priced reduced probability of near-term tightening. Post-input development identified: The FOMC decision is now resolved (4 days ago), removing the binary event risk that had suppressed conviction for weeks. Gold responded positively, breaking above $4,100 for the first time since the July decline. TradingEconomics confirms gold closed July 31 at $4,042.97 spot (-1.47% daily) after intraday highs above $4,112, with Reuters and CNBC reporting the Fed hold and gold's +2% weekly gain. Crucially, the World Gold Council's Q2 2026 report released July 30 showed record central bank purchases of 289 tonnes (+74% YoY), led by Poland and China, providing a structural demand floor that the Fundamental agent's most recent input (August 2) now reflects. The measured calibration context (Section 2A) shows this desk's accuracy at 67% over 36 calls with +1.90R average returns, and conviction >=8 in commodity class has been 70% accurate (+2.08R). However, the current evidence supports moderate conviction (6), not high conviction (8+), because: (a) the technical structure remains in a confirmed downtrend from January with price below both key MAs, (b) three FOMC dissenters indicate hawkish pressure that could crystallize, and (c) real yields remain elevated at restrictive levels. The discipline signals are constructive but not overwhelming: Fundamental BULLISH (+1 conf 6) on record Q2 central bank buying, Sentiment mildly BULLISH (+0.5 conf 4) on neutral VIX with no extreme positioning, Institutional mildly BEARISH (-1.5 conf 6) on spec long reduction from 120,779 to 110,685 contracts suggesting profit-taking, Technical mildly BEARISH (-1 conf 5) on continued corrective structure below MAs but RSI recovery to 52, Economic mildly BEARISH (-1 conf 6) on elevated real yields and hawkish Fed backdrop. The key structural tension is between record central bank buying providing a rising floor versus the persistent headwind from elevated real yields and Western ETF outflows. August-September seasonal tailwind now begins — historically the strongest period for gold — with the next critical catalyst being July 12 CPI providing directional clarity on the disinflation trend. With two consecutive CORRECT calls breaking the prior miss streak, the desk can resume directional calls from a reset position. The balance of evidence supports a mildly bullish lean: structural demand is accelerating (Q2 records), the FOMC binary risk has passed constructively, seasonal tailwinds are aligning, and price is stabilizing above $4,000 support. However, conviction is capped at 6 due to the conflicting bearish signals from the highest-weighted disciplines (Economic 0.25, Technical 0.15) and the lack of a single dominant catalyst strong enough to override the broader downtrend context.