Wheat Key Levels This Week — Support, Resistance & Confluence Zones
Wheat key levels breakdown: support zones, resistance zones, confluence and price structure.

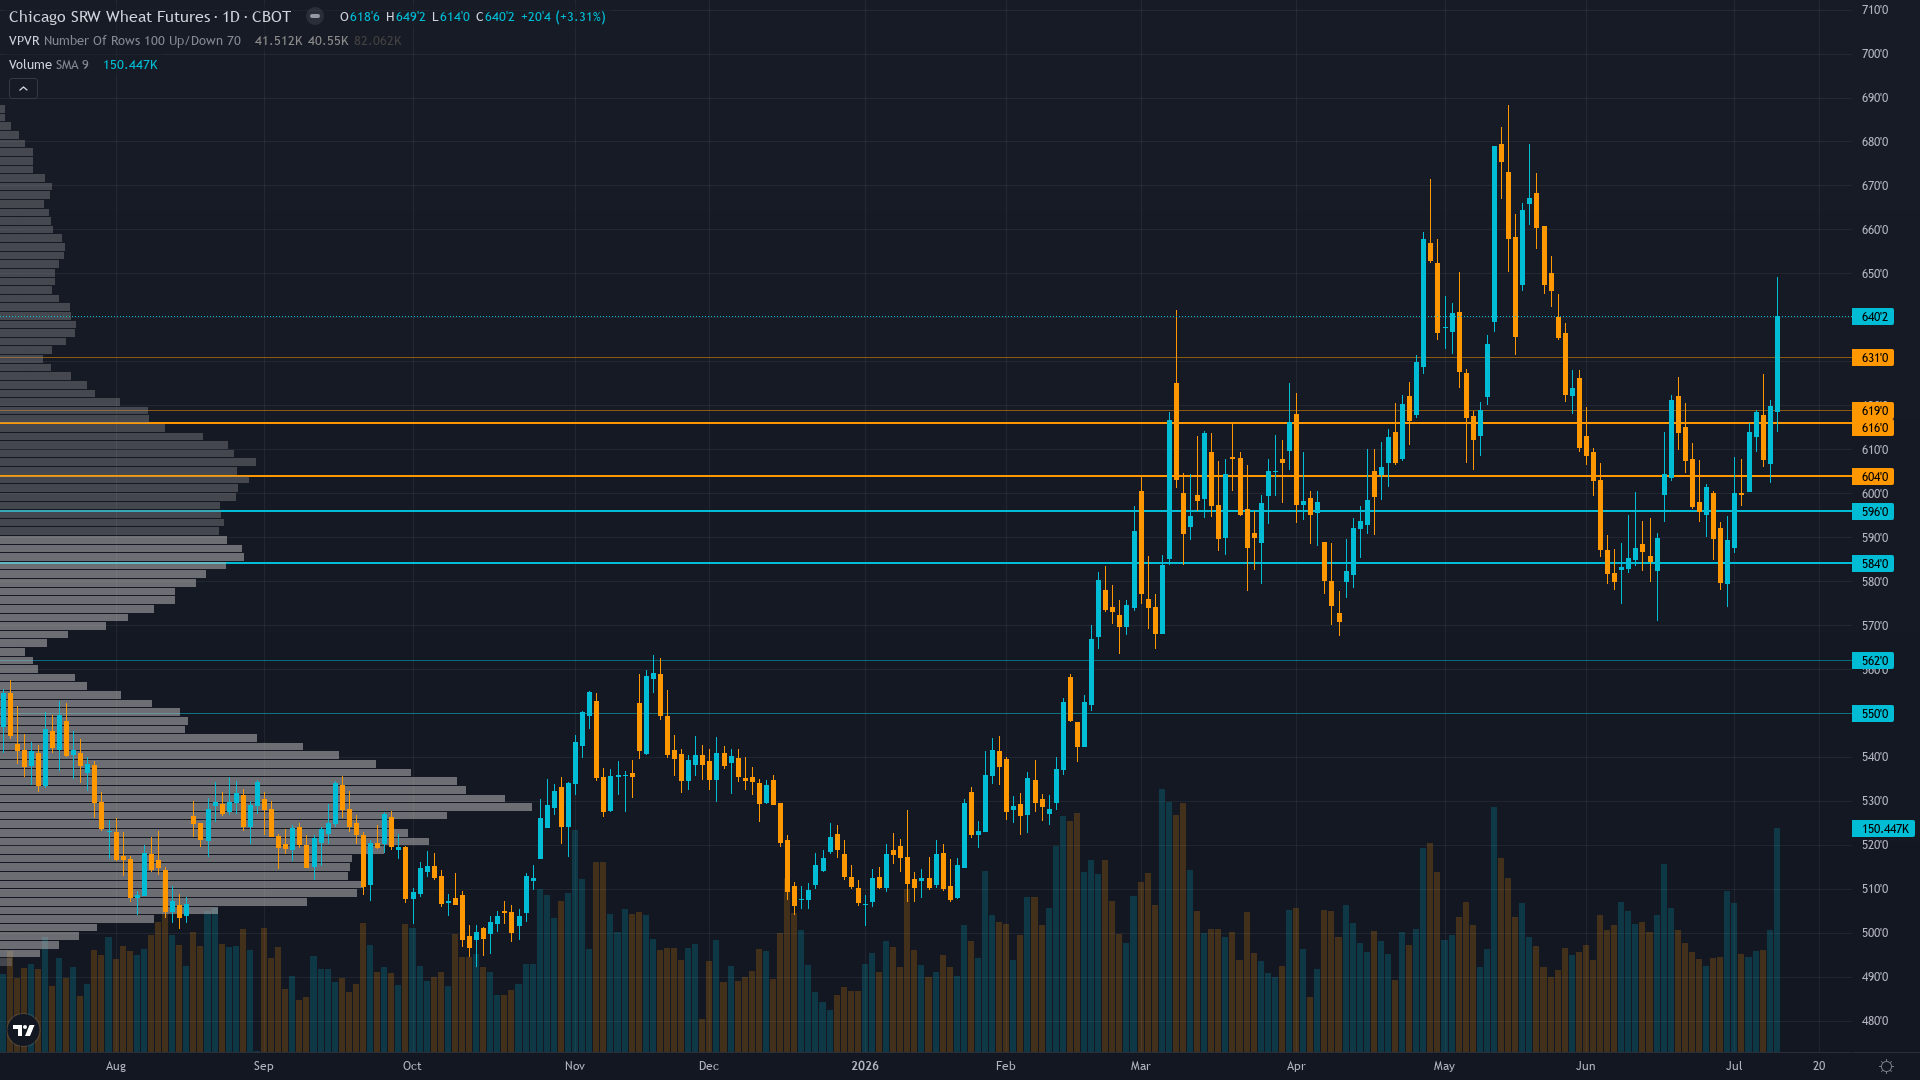
Structural Assessment
At 632, wheat has gained 3.39% over the past session with buying pressure clearly in the driving seat. wheat futures is in a breaking out market state, requiring careful assessment of current conditions.
Strong daily uptrend with price at 632 consolidating in 620-650 range after breaking above 600 psychological support and 609.54 Ichimoku resistance on July 10 WASDE catalyst, trading above both 50-day MA (~595) and 200-day MA (~605) with +7.71% monthly gain establishing higher highs and higher lows since early June creating bullish momentum, RSI estimated 55-65 range indicating constructive momentum without overbought extremes, W-formation (double bottom) reversal structure completed with measured move target 723 cents, immediate resistance at 650 (near 52-week high 688.25), immediate support at 620 (breakout consolidation), major support at 598.30 (daily pivot)
At 7/10, trend strength indicates a solid directional lean without being overextended.
Support Architecture
Support levels for wheat are defined by zones of prior institutional demand. The depth and frequency of prior tests at these levels determines their likely strength.
The strength of support depends on the current RISK-ON macro regime with VIX at 15.03 (July 10) well below 20 threshold indicating calm equity markets and complacent investor psychology, USD strength at 100.97 DXY (up 1.11% monthly, +3.18% YoY) creating export competitiveness headwind for U.S. wheat versus Black Sea suppliers, crude oil declining from prior peaks to $85/bbl (June average) with EIA forecasting further decline to $74/bbl Q3 easing input costs, creating environment where improving broad risk appetite provides supportive backdrop yet agricultural fundamentals must stand alone as dominant directional driver with commodity-specific supply-demand dynamics overwhelming macro cross-currents regime and volume profile at each level.
Upside Barriers
Resistance levels above CBOT wheat current price represent zones of historical supply. The significance of each level scales with the number of prior tests and the volume traded there.
The current breaking out regime influences how aggressively these resistance zones are likely to be tested and whether they hold or fold.
Confluence & Methodology
Confluence is the differentiator between a line on a chart and a level worth trading. For wheat futures, the zones with the highest conviction are those validated across technical, institutional, and derivatives dimensions simultaneously.
Beyond Lines on a Chart
Our approach to key levels is designed to filter noise from signal. Six independent agents each assess the same price zones from different perspectives. A level confirmed by one discipline is interesting. A level confirmed by four or five is worth building a trade plan around.
This multi-discipline approach means the levels in our paid reports carry institutional-grade confluence — not just lines on a chart, but zones validated across every analytical dimension that matters.
Our paid reports include specific support and resistance levels identified by six specialist agents — technical structure, institutional positioning, options flow, fundamentals, sentiment, and economic analysis. Not just lines on a chart, but zones validated by multi-discipline confluence.
Start Free — Get the Market of the WeekFree weekly report · No credit card · Upgrade anytime



