Wheat Forecast This Week — Outlook, Drivers & Key Levels
This week's Wheat outlook: key drivers, volatility context, risk-opportunity assessment and the week ahead.

This Week's Starting Point
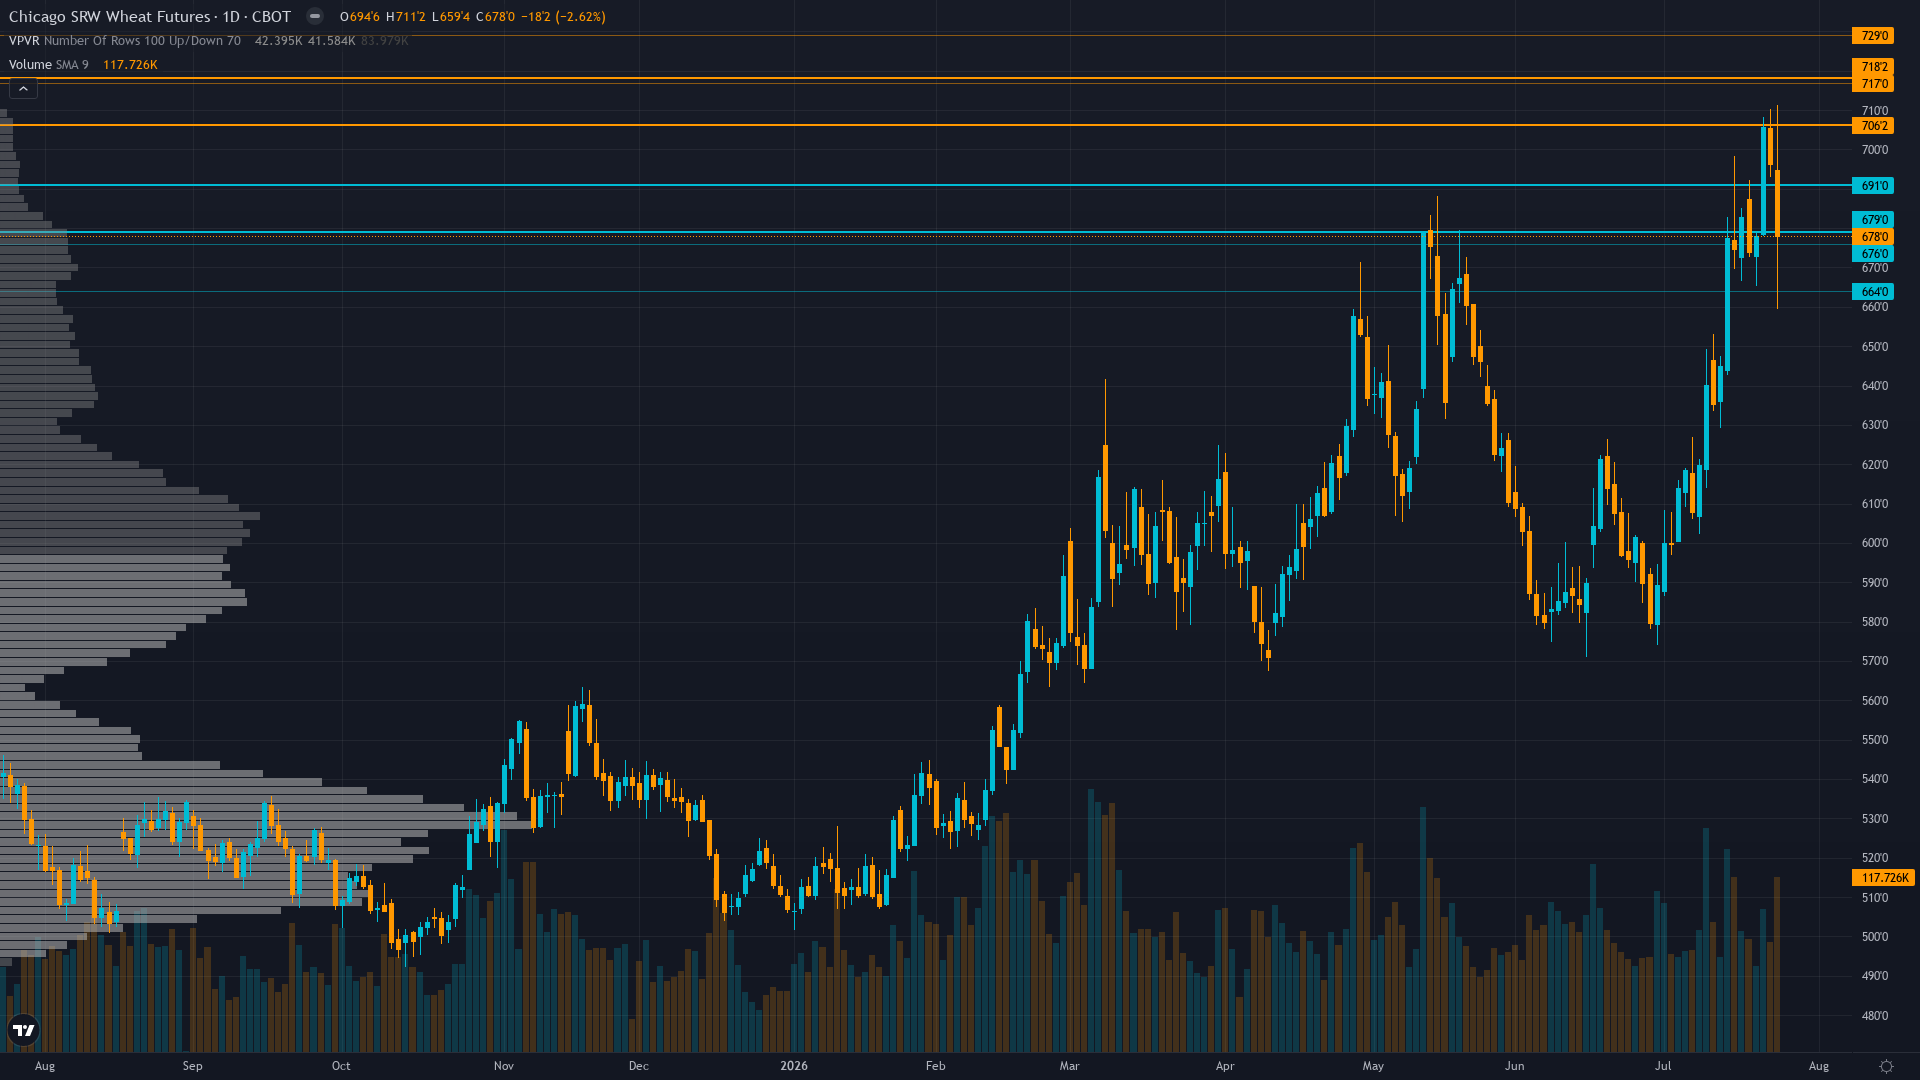
Trading at 679 after a 2.48% slide, wheat faces sustained selling interest. wheat futures is in a consolidating after pullback market state, requiring careful assessment of current conditions.
Cautiously bullish to neutral following mid-July rally reversal with market viewing advance from 632 to 712.25 highs as Black Sea geopolitical premium partially priced expecting seasonal June-August harvest pressure to cap upside near 690-700 resistance while acknowledging July 10 WASDE production catastrophe (1,536M bushels lowest since 1972) creates structural support at 650-660 levels preventing sharp breakdown absent material improvement in global supply outlook
Forces in Play
Primary driver: Black Sea geopolitical disruptions escalating with Ukrainian-Russian strikes threatening key export corridor creating supply premium competing against July 10 WASDE catalyst (16 days aged) showing 23% U.S. production decline now partially priced following -3.21% weekly decline from 701.50 to 679.0 as managed money positioning shift (+33k longs added July 16-22) removes extreme bearish stance yet price consolidating below 700 psychological resistance
Secondary factor: Post-input development identified: Trading Economics confirms wheat fell to 679 USd/Bu on July 24, 2026 (down 2.48% that day) representing sharp pullback from mid-July rally that reached 700+ cents on Black Sea export disruption premium per Bloomberg July 24 article stating 'wheat extends July rally as war risks stoke supply fears' with benchmark futures advancing 2.2% intraday heading for fourth weekly gain before Friday's profit-taking session
Additional influence: Entering peak Northern Hemisphere harvest pressure window (June-August historically weakest seasonal period for wheat per CME research showing tendency to decline between spring and July harvest) yet 2026 counter-seasonal strength from July 10 WASDE revealing U.S. production at 1,536 million bushels (lowest since 1972) creates tension where seasonal bearish patterns clash with severe supply fundamentals requiring resolution through August 12 WASDE
Economic backdrop: TRANSITIONAL macro regime with VIX 16.64 neutral, USD strength at 100.07 DXY (up 0.75% weekly) creating modest export competitiveness headwind offset by declining crude oil to $89/bbl (from $105 early-May highs) reducing agricultural input costs for diesel and fertilizer, Fed on hold at 3.50-3.75% rates with Chair Warsh maintaining higher-for-longer messaging per July 10 Monetary Policy Report creating stable yet uninspiring macro backdrop where improving risk appetite provides minimal tailwind as commodity-specific supply-demand dynamics dominate wheat directional pricing
Fundamental assessment: Profoundly conflicted with July 10 WASDE (16 days aged) confirming most severe U.S. production shortfall since 1972 at 1,536 million bushels (down 23% YoY) with only 26% crop rated good-to-excellent versus 48% last year and 69% drought coverage across winter wheat areas creating acute supply tightening, yet global stocks at 275.0 MMT (31.7% stocks-to-use ratio) with FAO projecting 2.2% contraction provides structural buffer creating fundamental tension where U.S. regional supply destruction meets global baseline oversupply that market must reconcile through export flow monitoring and demand response to elevated prices
Technical Landscape
Price at 679.0 consolidating in 665-690 range after -3.21% weekly pullback from 701.50 Monday open yet maintaining position above key 50-day MA (~650) and 200-day MA (~605) indicating medium-to-long-term uptrend structure intact despite short-term weakness, RSI estimated 50-55 range (neutral momentum), trading 38% above October 492 lows yet 4.7% below July 20 52-week high at 712.25 suggesting market has priced substantial drought premium without full commitment to production catastrophe scenario
Trend strength registers at 6/10, suggesting meaningful but not extreme directional bias.
Risk-Reward Assessment
Primary risk: Continued breakdown below 665 support toward testing 640-650 range as seasonal June-August harvest pressure combines with profit-taking from mid-July rally and global stocks at 275.0 MMT (31.7% stocks-to-use ratio) reassert structural oversupply narrative dominance over U.S. regional drought concerns while managed money positioning already reflecting material long-covering (+33k contracts added) removes additional short-squeeze fuel creating mean reversion risk from current 679 level toward 640 zone (Probability: medium)
Primary opportunity: August 12 WASDE confirms additional U.S. production downgrades beyond July 10 estimates from persistent 69% drought coverage with only 26% spring wheat rated good-to-excellent (versus 52% last year) or Black Sea export disruptions intensify beyond current logistics premiums triggering explosive rally from current modestly net-short positioning toward 710-720 range retest as W-formation measured move target of 723 cents becomes technically viable and late-season harvest data materializes yield losses exceeding market pricing at 679 cents (Timeframe: Next 2-3 weeks through August 12 WASDE and critical late-July/early-August harvest completion window for final 2026 production data from drought-affected regions plus ongoing monitoring of Black Sea geopolitical developments affecting Russian export capacity estimated down 13-20% in July per AgWeb July 15 analysis)
This week's edge: Market faces genuine uncertainty whether July 10 WASDE production catastrophe (1,536M bushels lowest since 1972, 69% drought coverage, 26% good-to-excellent ratings) combined with escalating Black Sea disruptions (Russian exports down 13-20% July per AgWeb) justifies current 679 pricing or if seasonal June-August harvest pressure and global 31.7% stocks-to-use ratio will drive mean reversion toward 640-660 support—desk maintains modest BULLISH lean at conviction 5 acknowledging last week's MISS yet seeing tail-risk scenario where August 12 WASDE materializes additional production downgrades triggering rally toward 710-720 range, though acknowledging probable move marginally exceeds noise threshold creating borderline directional call versus NO CALL alternative
Risk Environment
With vol at the 72th percentile, wheat price is trading in an elevated regime where daily ranges can surprise even experienced traders. Volatility is stable, with realised vol holding steady across timeframes. This equilibrium can persist but eventually resolves into expansion or contraction.
Seasonal Context
Historically, July 2026 has been a headwind for CBOT wheat, with seasonal data showing a 42% win rate. Harvest pressure as supply hits market.
Week Ahead Outlook
The next major catalyst is USDA August 2026 WASDE Report with updated 2026/27 winter wheat production estimates incorporating final July harvest completion data from drought-affected Southern Plains regions (69% drought coverage) plus initial spring wheat harvest progress from Northern Plains determining whether July 10 production downgrades (1,536M bushels lowest since 1972) represent floor or require further downward revision as actual harvest yields materialize from persistently stressed crop conditions on Wednesday 12 August — a high-impact event that could materially shift the directional picture.
For wheat, the balance between existing momentum and scheduled risk events sets the stage for the week ahead.
This analysis covers one dimension. Our full weekly report combines six specialist agents into a single actionable briefing with directional bias, key levels, and risk-opportunity matrix.
Start Free — Get the Market of the WeekFree weekly report · No credit card · Upgrade anytime



