Wheat Forecast This Week — Outlook, Drivers & Key Levels
This week's Wheat outlook: key drivers, volatility context, risk-opportunity assessment and the week ahead.

This Week's Starting Point
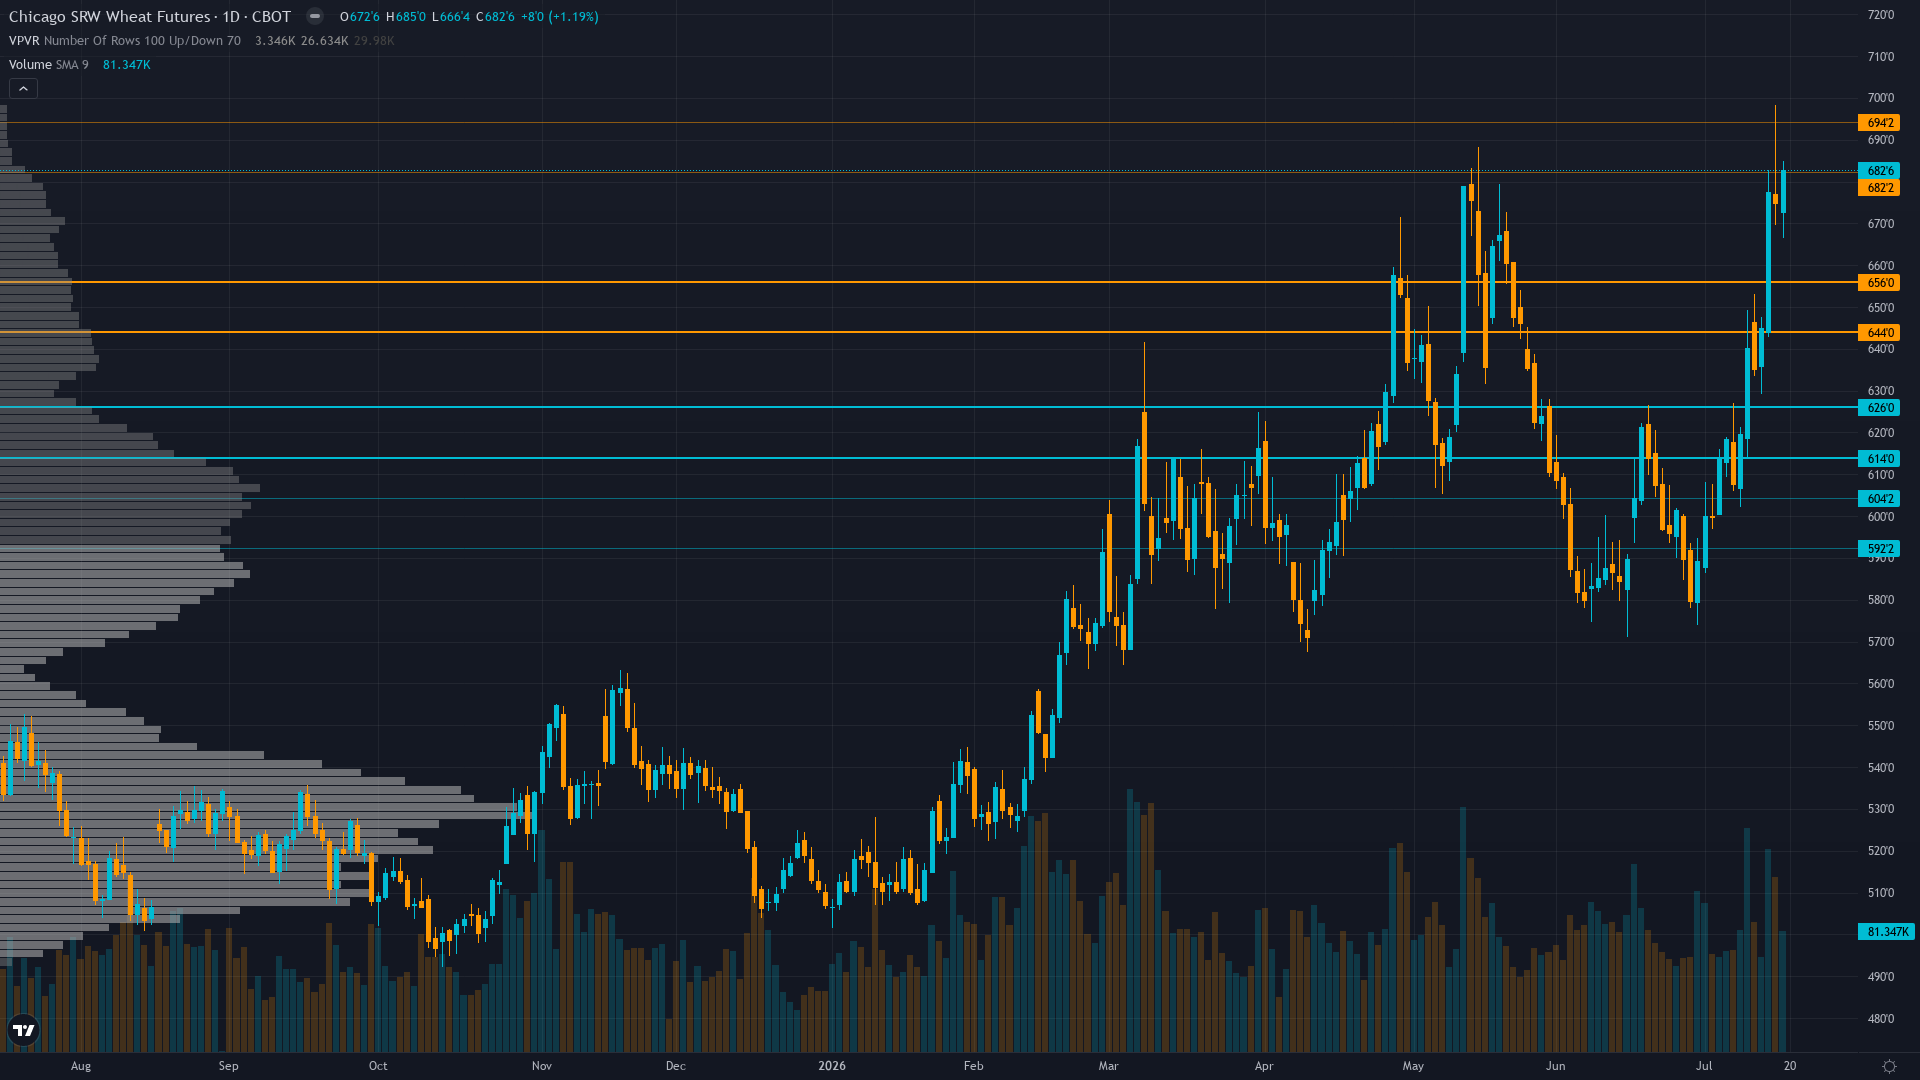
At 701.5, wheat has gained 4.08% over the past session with buying pressure clearly in the driving seat. wheat futures is in a breaking out market state, requiring careful assessment of current conditions.
Cautiously bullish on July 10 WASDE production shock confirming most severe U.S. wheat shortfall since 1972 with crop conditions at 26% good-to-excellent driving prices to May 2024 highs, yet increasingly concerned about sustainability above 700 given managed money record bearish positioning shift, global stocks at 275.0 MMT (34.52% stocks-to-use ratio), and approaching seasonal June-August harvest pressure creating expectation for consolidation in 685-715 range
Forces in Play
Primary driver: July 10 WASDE (9 days ago) confirmed catastrophic U.S. winter wheat production at 1,536 million bushels (down 23% YoY, smallest crop since 1972) with only 26% crop rated good-to-excellent versus 46% last year, yet managed money executed historic bearish positioning shift to net short -34,887 contracts (from net long +8,729) creating profound fundamental-institutional divergence where production catastrophe meets record spec shorts at 10.2% of open interest
Secondary factor: Post-input development identified: Trading Economics confirms wheat climbed toward $7.00/bushel in mid-July reaching highest level since May 20, 2024, as escalating Ukrainian and Russian strikes in the Black Sea raised concerns over export supply disruptions adding geopolitical premium to fundamental drought-driven rally with current price at 701.50 representing +28.42% YoY gain and within 1.5% of 52-week high at 712.25
Additional influence: Technical breakout structure confirmed with W-formation reversal pattern completed and price trading above 50-day and 200-day moving averages showing Strong Buy signals, yet price action now entering seasonally weak June-August Northern Hemisphere harvest period creating counter-seasonal strength that either validates severe supply destruction thesis or sets up mean reversion risk toward 670-680 support if global stocks at 275.0 MMT reassert oversupply dominance
Economic backdrop: RISK-ON macro regime with VIX 15.67 neutral, USD strength at 100.91 DXY (up 1.11% monthly from geopolitical safe-haven flows) creating export competitiveness headwind for U.S. wheat versus Black Sea suppliers, crude oil stable creating neutral input cost environment, Fed on hold with no rate moves expected near-term, yet geopolitical tensions in Black Sea (Ukraine-Russia strikes) and Middle East adding risk premium to grain markets creating environment where agricultural fundamentals dominate over broad risk appetite signals
Fundamental assessment: Profoundly bullish U.S. supply-side dynamics with July 10 WASDE confirming production at 1,536 million bushels (down 23% YoY, smallest since 1972) and Hard Red Winter at 1,048 million bushels (down 25% YoY, lowest since 1957) with only 26% crop rated good-to-excellent versus 46% last year and U.S. ending stocks down to 722 million bushels, yet global stocks at 275.0 MMT (34.52% stocks-to-use ratio) creates fundamental tension where catastrophic U.S. regional supply destruction meets global structural surplus baseline requiring export flow monitoring to determine whether domestic tightness translates to sustained price premium
Technical Landscape
Strong daily uptrend with price at 701.50 trading +28.42% YoY and within 1.5% of 52-week high at 712.25, positioned above 50-day MA (~650) and 200-day MA (~605) with W-formation breakout confirmed above 609.54 Ichimoku resistance establishing measured move target toward 723 cents, RSI estimated 60-65 range indicating bullish momentum without overbought extremes yet approaching resistance zone requiring volume confirmation to clear 712.25 breakout level
Trend strength is elevated at 8/10, indicating strong directional conviction in current price action.
Risk-Reward Assessment
Primary risk: August 12 WASDE confirms July 10 production forecasts as floor with no further deterioration as late-July rains provide modest yield salvage in final harvest stages, sending market back toward 670-680 support as global stocks at 275.0 MMT (34.52% stocks-to-use ratio) reassert structural oversupply narrative dominance over U.S. regional drought concerns while managed money already reflecting bearish consensus through -43,616 contract shift to net short removes additional downside fuel creating mean reversion risk from current 701.50 level (Probability: medium)
Primary opportunity: August 12 WASDE confirms additional U.S. production downgrades beyond July 10 estimates from persistent 69% drought coverage with only 26% spring wheat rated good-to-excellent (versus 52% last year) as late-season harvest data materializes yield losses exceeding current market pricing, triggering explosive short-covering rally from current record net short -34,887 positioning toward 720-730 range as W-formation measured move target of 723 cents becomes technically viable and specs forced to cover shorts built into seasonal July lows creating classic squeeze scenario where production catastrophe thesis overwhelms global oversupply narrative (Timeframe: Next 3-4 weeks through August 12 WASDE and critical late-July/early-August harvest completion window for final 2026 production data from drought-affected Southern Plains and Northern Plains spring wheat regions providing market clarity on whether July 10 WASDE catastrophic production forecasts represent floor or underestimate of actual damage from months-long 69% drought coverage)
This week's edge: Market may be underestimating tail-risk from July 10 WASDE production catastrophe (1,536 million bushels lowest since 1972, only 26% good-to-excellent crop ratings) where managed money executed record bearish positioning shift to net short -34,887 contracts (largest single-week change since 2006) creating asymmetric short-covering opportunity if August 12 WASDE or late-July/August harvest data confirms yield losses beyond current pricing at 701.50 cents, yet desk acknowledges global 34.52% stocks-to-use ratio and seasonal June-August harvest pressure create genuine structural headwinds requiring measured conviction 7 versus entrenched bullish stance given recent positioning dynamics and counter-seasonal price strength demanding analytical discipline
Risk Environment
With vol at the 72th percentile, wheat price is trading in an elevated regime where daily ranges can surprise even experienced traders. Volatility is stable, with realised vol holding steady across timeframes. This equilibrium can persist but eventually resolves into expansion or contraction.
Seasonal Context
Historically, July 2026 has been a headwind for CBOT wheat, with seasonal data showing a 42% win rate. Harvest pressure as supply hits market.
Week Ahead Outlook
The next major catalyst is USDA August 2026 WASDE Report with updated 2026/27 winter wheat production estimates incorporating final July harvest completion data from drought-affected Southern Plains regions plus initial spring wheat harvest progress from Northern Plains determining whether July 10 production downgrades (1,536M bushels) represent floor or require further downward revision as actual harvest yields materialize from 69% drought-affected areas on Wednesday 12 August — a high-impact event that could materially shift the directional picture.
For wheat, the balance between existing momentum and scheduled risk events sets the stage for the week ahead.
This analysis covers one dimension. Our full weekly report combines six specialist agents into a single actionable briefing with directional bias, key levels, and risk-opportunity matrix.
Start Free — Get the Market of the WeekFree weekly report · No credit card · Upgrade anytime



