Wheat Forecast This Week — Outlook, Drivers & Key Levels
This week's Wheat outlook: key drivers, volatility context, risk-opportunity assessment and the week ahead.

Where Things Stand
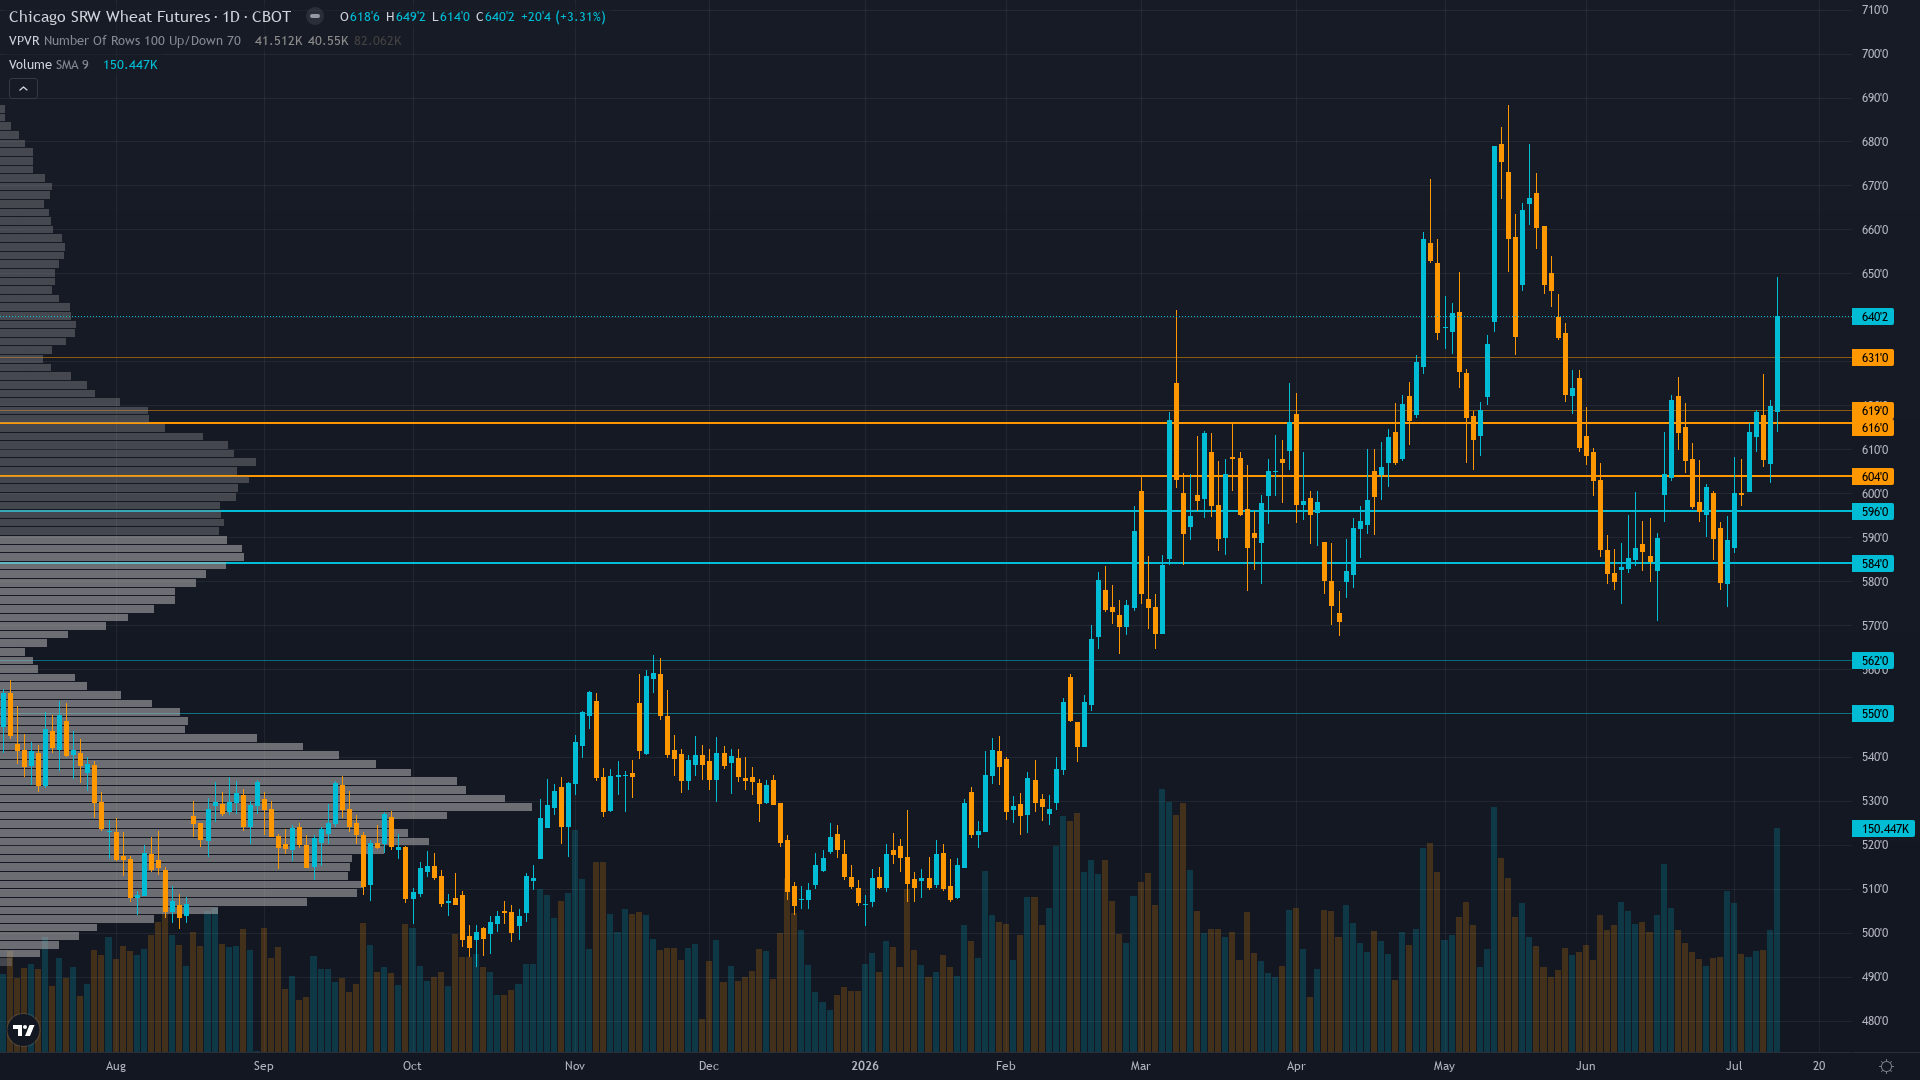
wheat stands at 632, having rallied 3.39% as bulls press their advantage. wheat futures is in a breaking out market state, requiring careful assessment of current conditions.
What's Driving Price
Primary driver: July 10 WASDE (2 days ago) confirmed catastrophic U.S. 2026/27 production at 1,536 million bushels (down 7M from June, down 25% YoY for Hard Red Winter—smallest since 1957/58) with only 26% crop rated good-to-excellent versus 48% last year, triggering explosive +6.59% weekly rally from 599.75 to 639.25 that validates fundamental supply destruction thesis against global 32% stocks-to-use ratio baseline
Secondary factor: Post-input development identified: Trading Economics confirms wheat rose to 632 USd/Bu on July 10, 2026 (up 3.39% that day, +7.71% monthly, +15.96% YoY) representing material breakout above 600 psychological support and 620 immediate resistance following July 10 WASDE catalyst release that materialized production downgrades beyond market expectations with technical W-formation breakout confirmed above 609.54 Ichimoku resistance establishing measured move target toward 723 cents
Additional influence: Institutional positioning executed counterintuitive bearish shift with managed money ADDING approximately 14,000 short contracts week-over-week (as of July 8 COT data) despite July 10 WASDE production shock, creating classic contrarian squeeze setup where specs are building shorts into harvest pressure WHILE fundamental supply destruction intensifies, removing downside fuel yet providing explosive short-covering potential if August WASDE confirms additional yield losses from persistent 69% drought coverage affecting winter wheat production areas
Economic backdrop: RISK-ON macro regime with VIX 15.03 neutral yet USD strength to 100.97 DXY (up 1.11% monthly) following geopolitical safe-haven flows creates direct export competitiveness headwind for U.S. wheat pricing versus Black Sea competitors, crude oil declining to $85/bbl (June) from prior $105+ peaks with EIA forecasting $74/bbl Q3 reducing input costs (diesel, fertilizer) for agricultural margins, Fed maintaining 3.50-3.75% rates at June 17 FOMC with no language shifts and policy fully priced, IMF July WEO Update projects EM growth slowing to 3.8% in 2026 indicating softer global demand trajectory for wheat imports from key buyers in North Africa and Middle East
Fundamental assessment: Profoundly conflicted with July 10 WASDE confirming most catastrophic U.S. winter wheat production since 1957/58 at 1,536 million bushels (down 25% YoY for Hard Red Winter) with only 26% good-to-excellent crop ratings (versus 48% last year) and 69% drought coverage across winter wheat production areas creating acute supply tightening with U.S. ending stocks down to 722 million bushels (down 22M from June), yet global stocks remain structurally ample at 275.42 MMT with 32% stocks-to-use ratio creating fundamental tension where U.S. regional supply destruction meets global structural surplus baseline that market must reconcile through export flow monitoring and demand response to elevated prices
Chart Assessment
Strong daily uptrend with price at 632 consolidating in 620-650 range after breaking above 600 psychological support and 609.54 Ichimoku resistance on July 10 WASDE catalyst, trading above both 50-day MA (~595) and 200-day MA (~605) with +7.71% monthly gain establishing higher highs and higher lows since early June creating bullish momentum, RSI estimated 55-65 range indicating constructive momentum without overbought extremes, W-formation (double bottom) reversal structure completed with measured move target 723 cents, immediate resistance at 650 (near 52-week high 688.25), immediate support at 620 (breakout consolidation), major support at 598.30 (daily pivot)
With trend strength at 7/10, there's a clear directional tilt but room for the move to develop further.
Risk & Opportunity
Primary risk: August 12 WASDE confirms July 10 production forecasts as floor with no further deterioration as late-July rains provide modest yield salvage in final harvest stages, sending market back toward 598-610 support as global stocks at 32% stocks-to-use ratio (275.42 MMT) reassert structural oversupply narrative dominance over U.S. regional drought concerns while managed money positioning already reflecting bearish consensus through 14,000 additional shorts added week-over-week creates balanced risk without extreme positioning to fuel sustained decline (Probability: medium)
Primary opportunity: August 12 WASDE confirms additional U.S. production downgrades beyond July 10 estimates from persistent 69% drought coverage with only 26% spring wheat rated good-to-excellent (versus 52% last year) as late-season harvest data materializes yield losses exceeding current market pricing at 632 cents, triggering explosive short-covering rally from current institutional short positioning toward 670-688.25 range as W-formation measured move target of 723 cents becomes technically viable and specs forced to cover shorts built into seasonal July lows creating classic squeeze scenario where production catastrophe thesis overwhelms global oversupply narrative (Timeframe: Next 4-5 weeks through August 12 WASDE and critical late-July/early-August harvest completion window for final 2026 production data from drought-affected Southern Plains and Northern Plains spring wheat regions providing market clarity on whether July 10 WASDE catastrophic production forecasts (1,536M bushels Hard Red Winter lowest since 1957/58) represent floor or underestimate of actual damage from months-long 69% drought coverage that cannot be reversed by isolated late-season rainfall events)
Seasonal Context
Historically, July 2026 has been a headwind for wheat price, with seasonal data showing a 42% win rate. Harvest pressure as supply hits market.
Week Ahead Outlook
The next major catalyst is USDA August 2026 WASDE Report with updated 2026/27 winter wheat production estimates incorporating final July harvest completion data from drought-affected Southern Plains regions plus initial spring wheat harvest progress from Northern Plains determining whether July 10 production downgrades (1,536M bushels) represent floor or require further downward revision as actual harvest yields materialize from 69% drought-affected areas with only 26% good-to-excellent crop ratings on Wednesday 12 August — a high-impact event that could materially shift the directional picture.
For ZW futures, the balance between existing momentum and scheduled risk events sets the stage for the week ahead.
This analysis covers one dimension. Our full weekly report combines six specialist agents into a single actionable briefing with directional bias, key levels, and risk-opportunity matrix.
Start Free — Get the Market of the WeekFree weekly report · No credit card · Upgrade anytime



