Wheat Forecast This Week — Outlook, Drivers & Key Levels
This week's Wheat outlook: key drivers, volatility context, risk-opportunity assessment and the week ahead.

Where Things Stand
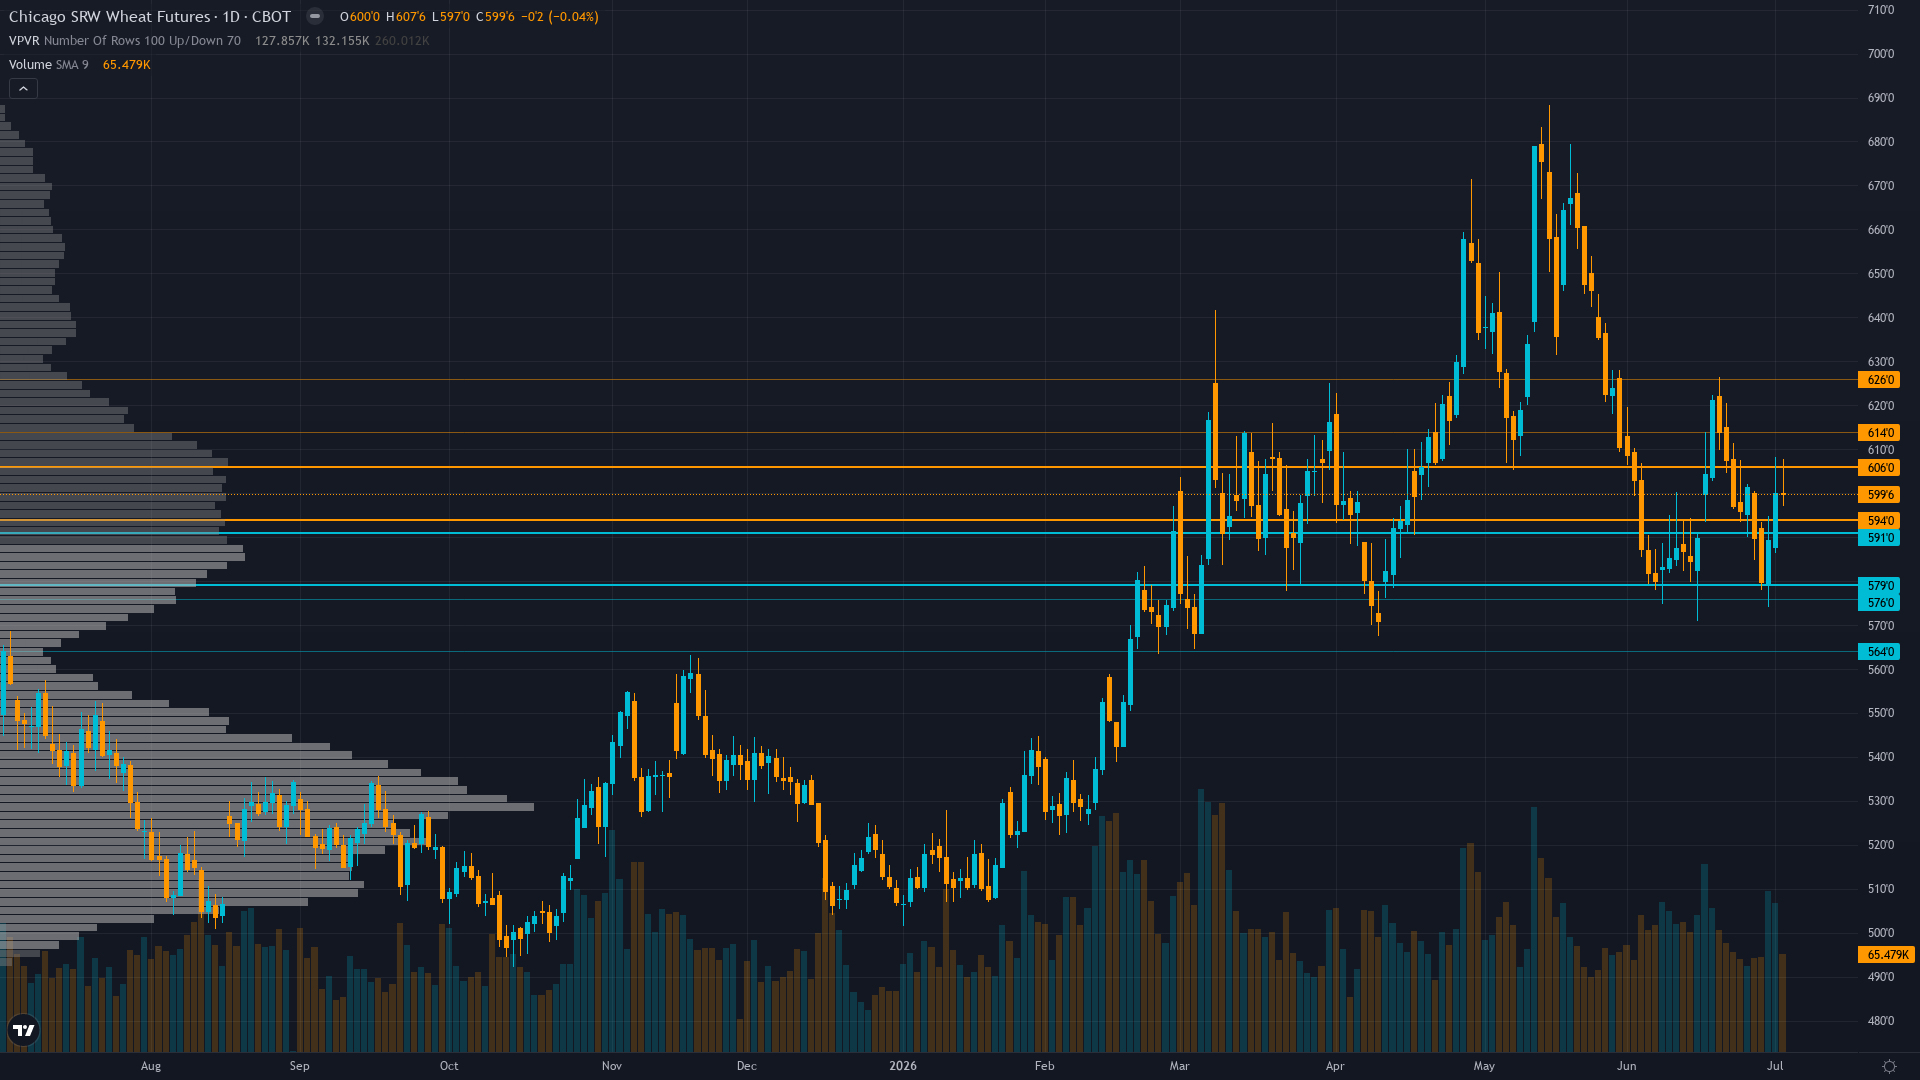
At 599.75, wheat has inched 0.12% higher in a measured advance. wheat futures is in a consolidating in range market state, requiring careful assessment of current conditions.
Mixed to cautiously neutral with fundamental analysts acknowledging June 11 WASDE catastrophic U.S. production shock (1,048M bushels Hard Red Winter lowest since 1957) yet skeptical about sustainability of drought premium given global stocks at 31.7% stocks-to-use ratio (275.42 MMT) expecting seasonal June-August harvest pressure to contain upside near 610-625 resistance while managed money at 2026 net short maximum suggests positioning reflects bearish consensus awaiting July 10 WASDE clarity
What's Driving Price
Primary driver: July 10 WASDE binary event risk 5 days away creates mandatory analytical caution while wheat consolidates at 599.75 cents in 556-625 range with conflicting discipline signals: managed money at 2026 net short maximum (extreme bearish positioning creating contrarian squeeze potential) clashes with global stocks at 31.7% stocks-to-use ratio (275.42 MMT) overwhelming June 11 WASDE catastrophic U.S. production shock (1,048M bushels lowest Hard Red Winter since 1957)
Secondary factor: Post-input development identified: Trading Economics reports wheat rose toward $5.90/bushel in early July, moving away from near four-month low reached previously, confirming Technical agent's consolidation thesis with current price at 599.75 positioned above 50-day and 200-day moving averages yet below 20-day MA at approximately 610-615 creating range-bound structure without directional conviction ahead of July 10 catalyst
Additional influence: Institutional positioning at historic 2026 net short maximum per June 29 AgWeb commentary stating 'funds are mostly done because we're approaching our 2026 net short max position right now by managed money' following 14,000 shorts added in late May, creating balanced two-way risk where extreme bearish positioning removes downside fuel yet provides asymmetric short-covering potential if July 10 WASDE confirms additional production downgrades beyond June 11 estimates
Economic backdrop: TRANSITIONAL macro regime with VIX 16.45 neutral, USD at 100.77 DXY (down 0.66% in 24 hours ending July 1) following recent decline from 105+ levels creating modest tailwind for U.S. export competitiveness versus Black Sea suppliers, yet crude oil elevated at $105/bbl due to Strait of Hormuz geopolitical disruptions raising input costs (diesel, fertilizer) for agricultural production creating mixed margin environment where commodity-specific supply fundamentals must dominate over broad macro signals
Fundamental assessment: Profoundly conflicted with June 11 WASDE (24 days ago) confirming most catastrophic U.S. wheat production since 1972 at 1,048 million bushels Hard Red Winter (down 25% YoY, lowest since 1957 per Reuters) with 69% of winter wheat areas in drought and only 28% crop rated good-to-excellent versus 46% last year, yet global stocks remain structurally ample at 275.42 MMT with comfortable 31.7% stocks-to-use ratio creating fundamental tension where U.S. regional supply destruction meets global oversupply baseline that market appears to be pricing as dominant force via current 599.75 level representing modest overvaluation 5-8% versus fundamentals per Fundamental agent
Chart Assessment
Price at 599.75 consolidating in 556-625 range positioned above 50-day MA (~595) and 200-day MA (~605) indicating medium-to-long-term support yet below 20-day MA at approximately 610-615 signaling short-term weakness within broader sideways pattern, with resistance major at 740 cents (prior swing high), resistance immediate at 625 (upper range bound), support immediate at 590 (recent pivot low), and support major at 556 (lower boundary of established trading range)
With trend strength at 4/10, the directional signal is present but far from decisive.
Risk & Opportunity
Primary risk: July 10 WASDE confirms June 11 production forecasts as floor with no further deterioration from drought conditions or reveals timely late-June rainfall salvaged some yield potential sending market toward 556-575 support as global stocks at 31.7% stocks-to-use ratio (275.42 MMT) reassert structural oversupply narrative dominance over U.S. regional drought concerns while managed money already at 2026 net short maximum positioning reflects bearish consensus priced (Probability: medium)
Primary opportunity: July 10 WASDE confirms additional U.S. production downgrades beyond June 11 estimates from persistent 69% drought coverage affecting winter wheat areas with only 28% crop rated good-to-excellent (versus 46% last year) triggering explosive short-covering rally from current 2026 maximum net short positioning toward 625-640 range as late-season weather stress materializes sustained yield losses exceeding current market pricing at 599.75 cents creating classic squeeze scenario where specs forced to cover extreme shorts into rising prices (Timeframe: Next 5-10 days through July 10 WASDE and critical early-July harvest completion window for final 2026 production data from drought-affected Southern Plains regions providing market clarity on whether June 11 WASDE catastrophic production forecasts (1,048M bushels Hard Red Winter lowest since 1957) represent floor or underestimate of actual damage from months-long drought stress that cannot be fully reversed by isolated rainfall events)
This week's edge: Market faces genuine analytical uncertainty ahead of July 10 WASDE binary event 5 days away where conflicting signals between global oversupply fundamentals (31.7% stocks-to-use ratio, 275.42 MMT) and U.S. regional production catastrophe (June 11 WASDE showing 1,048M bushels Hard Red Winter lowest since 1957, 69% drought coverage, 28% good-to-excellent ratings) combined with managed money at 2026 net short maximum positioning and current price consolidation in 556-625 range creates balanced two-way risk without clear directional edge - desk acknowledges insufficient information advantage to overcome 0.75% noise threshold and binary catalyst uncertainty until July 10 WASDE provides production clarity determining whether June 11 estimates represent floor or underestimate of actual drought damage
Volatility Backdrop
wheat price volatility at the 65th percentile reflects a balanced environment where standard risk parameters apply. Volatility remains anchored at current levels, with no clear signal of an imminent regime shift in either direction.
Historical Seasonal Bias
Seasonal patterns flag a bearish tendency for CBOT wheat in July 2026 (42% win rate). Harvest pressure as supply hits market.
What to Watch
The USDA July 2026 WASDE Report with updated winter wheat production estimates incorporating final spring weather conditions and harvest progress data from drought-affected Southern Plains areas (69% drought coverage) plus initial 2026/27 crop year demand projections determining whether June 11 production downgrades (1,048M bushels Hard Red Winter lowest since 1957) represent floor or require further downward revision as late-season harvest data materializes actual yield losses from months-long drought stress on Friday 10 July stands as the week's primary risk event — high-impact and capable of overriding the existing technical and sentiment setup.
The interplay between consolidating in range market conditions and upcoming catalysts will define this week's trading landscape for ZW futures.
This analysis covers one dimension. Our full weekly report combines six specialist agents into a single actionable briefing with directional bias, key levels, and risk-opportunity matrix.
Start Free — Get the Market of the WeekFree weekly report · No credit card · Upgrade anytime



