Wheat Forecast This Week — Outlook, Drivers & Key Levels
This week's Wheat outlook: key drivers, volatility context, risk-opportunity assessment and the week ahead.

Market Overview
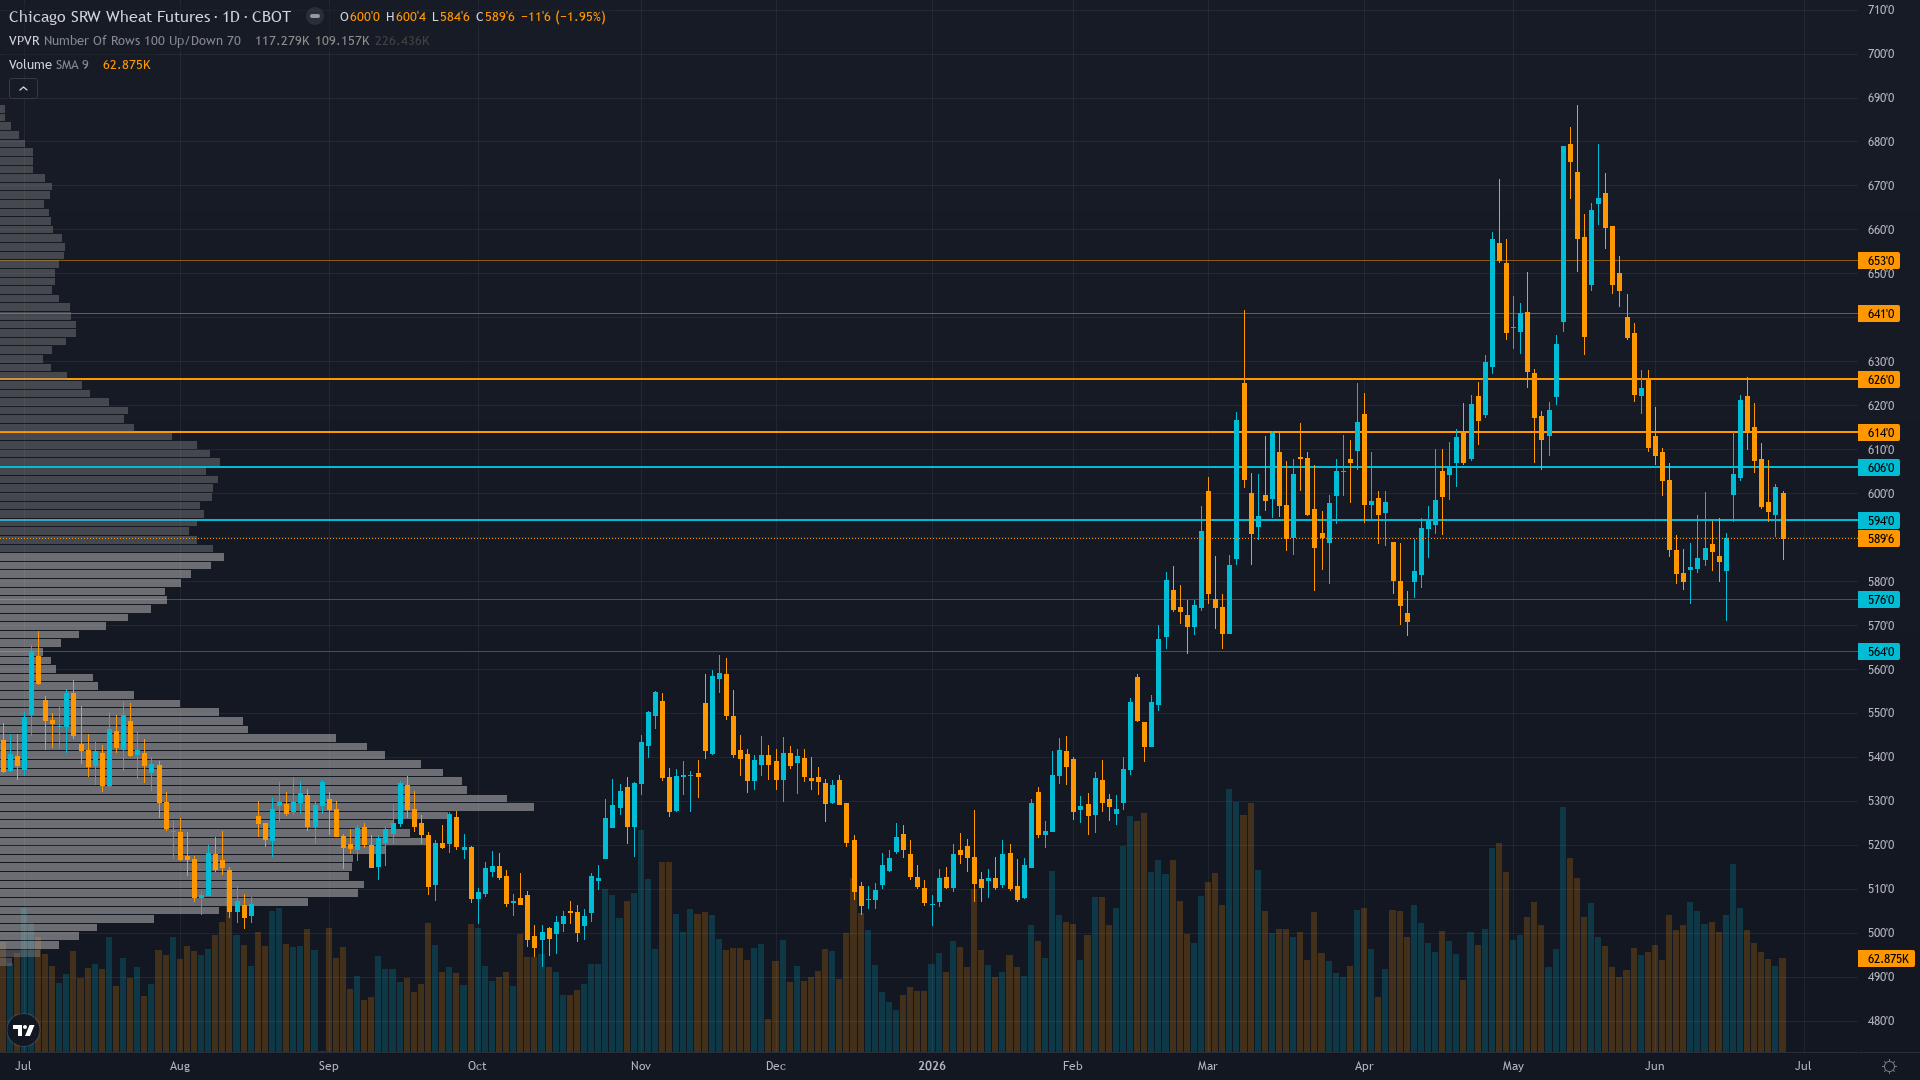
wheat is trading at 588.75, down 1.87% as selling pressure weighs on price. wheat futures is in a breaking down market state, requiring careful assessment of current conditions.
Mixed to bearish following June 11 WASDE production shock that has been fully priced with market viewing U.S. supply destruction as insufficient to overcome global stocks at 951.5 million tonnes (34.52% stocks-to-use ratio) expecting seasonal June-August harvest pressure to drive prices toward 570-580 support as structural oversupply narrative dominates despite catastrophic domestic production data
Upside & Downside
Primary risk: Continued breakdown below 585 support toward testing 570-575 range (June 15 two-month lows) as June-August seasonally weak Northern Hemisphere harvest pressure combines with managed money record net short -77,593 positioning already reflecting bearish consensus and global stocks at 951.5 million tonnes (34.52% stocks-to-use ratio) reasserting structural oversupply narrative dominance over U.S. regional drought concerns despite catastrophic June 11 WASDE production data (Probability: high)
Primary opportunity: July 10 WASDE confirms additional U.S. production downgrades beyond June 11 estimates from persistent 69% drought coverage with only 26% spring wheat rated good-to-excellent (versus 52% last year) triggering explosive short-covering rally from current record net short -77,593 positioning toward 620-630 range as late-season weather stress materializes sustained yield losses exceeding current market pricing at 588.75 cents creating classic squeeze scenario where specs forced to cover extreme shorts (Timeframe: Next 2-3 weeks through July 10 WASDE and critical late-June/early-July harvest completion window for final 2026 production data from drought-affected Southern Plains regions providing market clarity on whether June 11 WASDE catastrophic production forecasts represent floor or underestimate of actual damage)
This week's edge: Resetting after 3 consecutive misses - thesis under review per Rule 5 mandatory protocol. Market faces genuine analytical uncertainty where June 11 WASDE catastrophic U.S. production reality (1,048 million bushels lowest since 1972, Hard Red Winter at 1957 lows, 69% drought coverage) clashes with global structural oversupply at 951.5 million tonnes and managed money extreme net short -77,593 positioning creating balanced two-way risk ahead of July 10 WASDE without sufficient edge to overcome 0.75% noise threshold until fresh catalyst provides directional clarity.
Key Drivers This Week
Primary driver: MANDATORY NEUTRAL RESET per Rule 5 after 3 consecutive missed directional calls (June 26 BULLISH missed -3.66%, June 19 NO CALL missed +3.65%, June 12 BEARISH missed +0.86%) - thesis under review before resuming directional analysis on ZW wheat futures
Secondary factor: Current price at 588.75 cents per bushel represents -3.66% weekly decline from Monday open 611.10, breaking below 600 psychological support and 590 immediate support per Technical agent, confirming downtrend momentum despite June 11 WASDE (17 days ago) revealing catastrophic U.S. winter wheat production at 1,048 million bushels (down 25% YoY, lowest since 1972)
Additional influence: Managed money positioning at extreme net short -77,593 contracts (June 9 COT data, largest bearish extreme on record since 2006 per Institutional agent) creates asymmetric short-covering risk yet removes downside fuel, while global stocks at 951.5 million tonnes (34.52% stocks-to-use ratio) provides structural oversupply buffer market pricing as dominant force over U.S. regional drought concerns
Economic backdrop: TRANSITIONAL macro regime with VIX 16.41 neutral, USD strength at 101.37 DXY (up 2.12% monthly) creating direct export headwind for U.S. wheat competitiveness versus Black Sea suppliers, crude oil elevated at $105/bbl yet forecasted declining, Fed on hold per June 2025 FOMC projections with no rate moves until Q3 2027
Fundamental assessment: Profoundly conflicted - June 11 WASDE confirmed most catastrophic U.S. wheat production since 1972 at 1,048 million bushels winter wheat (down 25% YoY) with Hard Red Winter at 1957 lows and 69% drought coverage, yet global stocks at 951.5 million tonnes (34.52% stocks-to-use ratio) creates fundamental tension where U.S. regional supply destruction meets global structural surplus baseline that market prices as dominant
Price Structure
Confirmed downtrend with price at 588.75 well below 50-day MA (~610) and 200-day MA (~605) after breaking 600 psychological support and 590 immediate support, RSI oversold 35-40 range without clear bullish divergence, testing major support at 585-590 zone with next downside target at 570 June 15 two-month low
Trend strength registers just 3/10, which typically corresponds to choppy, directionless price action.
Volatility Regime
Volatility for wheat price is at the 68th percentile over 90 days — a normal regime that allows for standard position sizing and conventional trade management. The vol trend is flat, with no meaningful shift across timeframes. Stable vol environments often lull traders before a regime change arrives.
Daily ranges expanded from prior 15-20 cents to current 18-26 cent action following June 11 WASDE breakdown and subsequent testing of 585-590 support requiring wider stops - sustained move below 585 psychological support or recovery above 600 would trigger accelerated directional moves given failed rally structure from May highs and elevated volatility environment with July 10 WASDE 12 days away representing next major binary catalyst for potential 3-5% move in either direction
What History Shows
CBOT wheat enters a seasonally bullish window in June 2026, backed by a 65% historical win rate. Winter wheat harvest begins, weather-driven.
The Week Ahead
USDA July 2026 WASDE Report with updated winter wheat production estimates incorporating final spring weather conditions and harvest progress data from drought-affected Southern Plains areas plus initial 2026/27 crop year demand projections determining whether June 11 production downgrades represent floor or require further downward revision on Friday 10 July is a high-impact catalyst with the potential to redefine the near-term outlook entirely.
How wheat futures navigates the confluence of breaking down conditions and incoming data will determine whether the current directional thesis holds or breaks.
This analysis covers one dimension. Our full weekly report combines six specialist agents into a single actionable briefing with directional bias, key levels, and risk-opportunity matrix.
Start Free — Get the Market of the WeekFree weekly report · No credit card · Upgrade anytime



