Wheat COT & Institutional Positioning — Smart Money Analysis
Wheat institutional positioning: COT data, sentiment analysis and smart money flow assessment.

Institutional Positioning
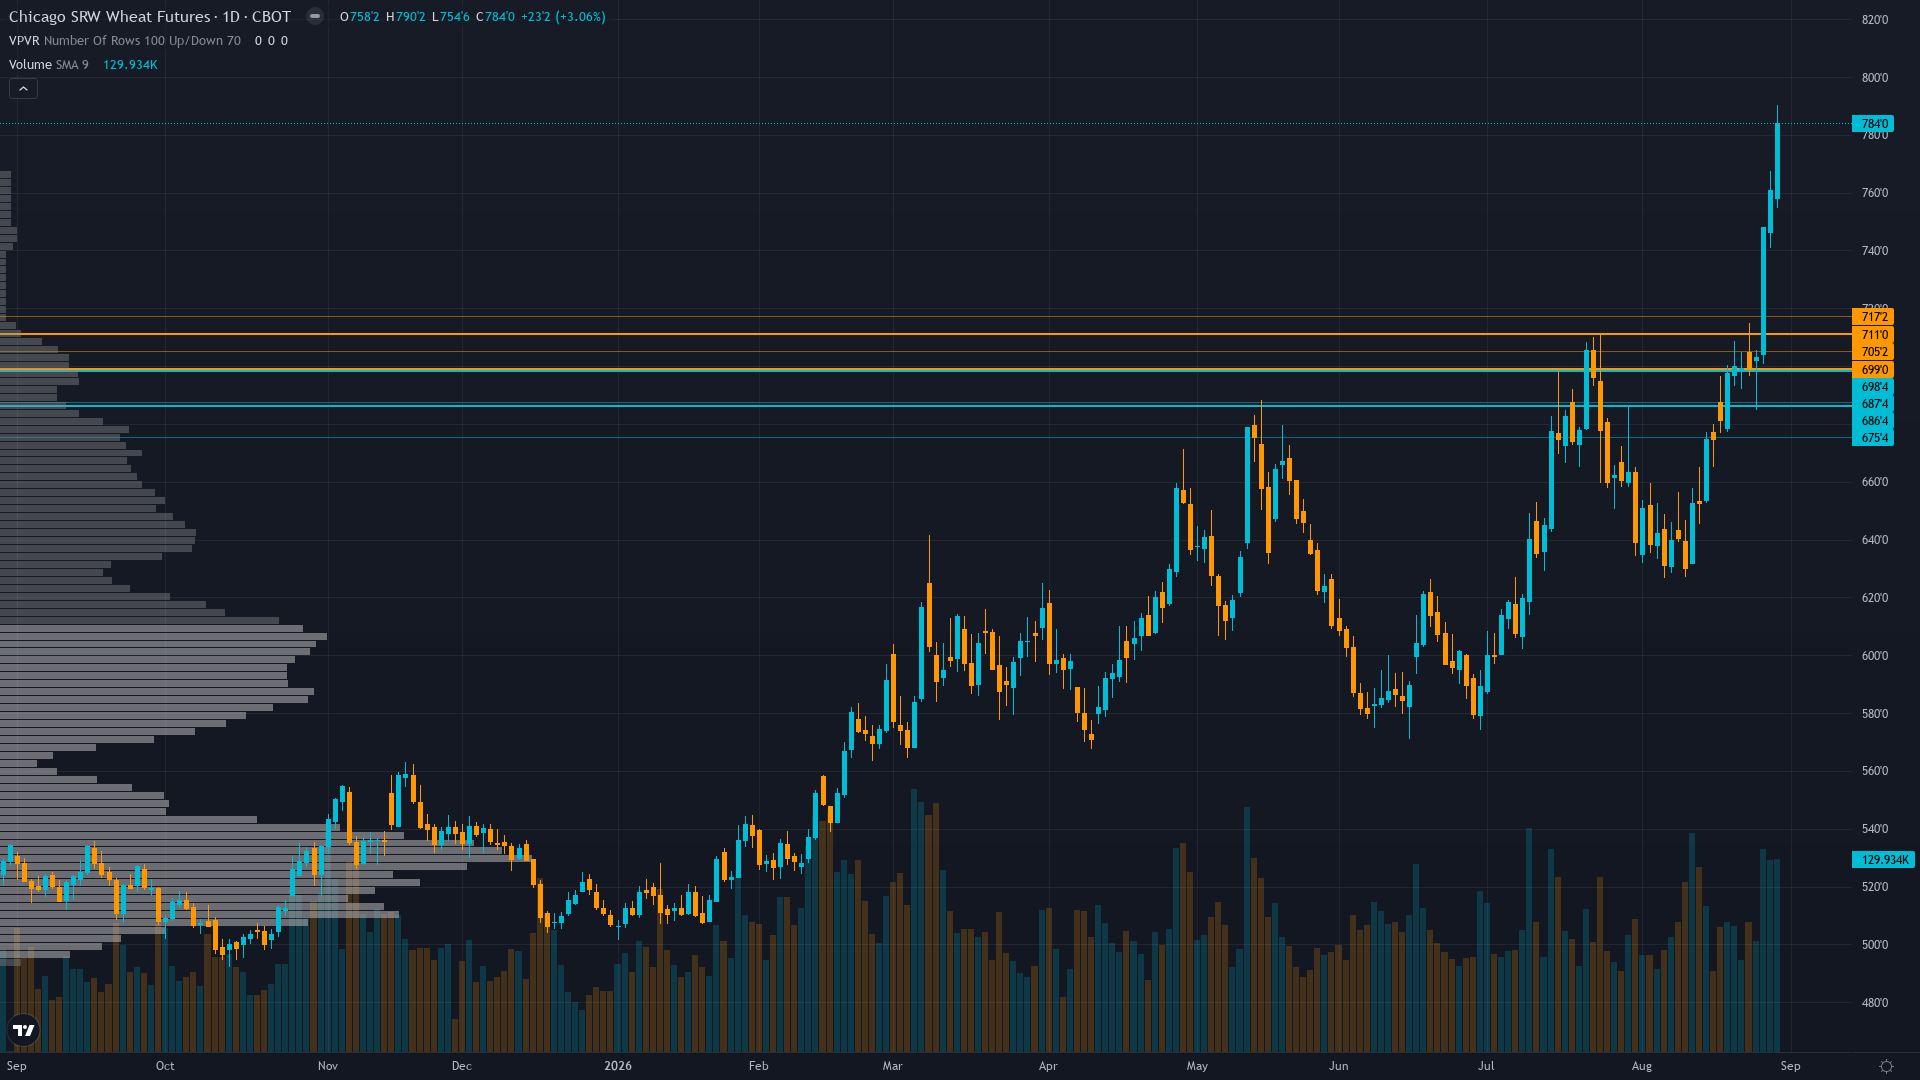
Trading at 767 after a 3.13% move higher, wheat continues to attract buying interest.
Non-commercials remain net short -6,779 contracts at 96.2nd percentile of 3-year range (CFTC Aug 25) despite covering 11,986 shorts last week, creating extreme contrarian squeeze setup as specs remain heavily short into a generational supply crisis with commercials net long +7,475 contracts providing institutional support
Where We Agree & Diverge
Market consensus: Bullish with Black Sea supply crisis and tight US fundamentals driving prices to 3-year highs, supported by extreme short covering from managed money, with market eyeing 800 psychological resistance as next upside target
Primary driver: Black Sea grain export collapse with Ukrainian drone strikes having taken >97% of Russian and Ukrainian grain export capacity in the Azov-Black Sea basin offline (Moscow Times Aug 17, Business Recorder Aug 20), with all three Novorossiysk grain terminals suspended and facilities representing >15M tons annual capacity damaged, creating a multi-month structural supply disruption that forces global buyers to pivot to already-limited U.S. supplies
Consensus Gaps
The desk sees a structural Black Sea supply crisis (>97% of Russian/Ukrainian export capacity offline) and extreme speculative short positioning at 96.2nd percentile that the market's price action has only partially repriced, while CFTC data shows specs remain net short into a generational supply event — this positioning-priced gap represents a blindspot the consensus has not yet fully incorporated
Sentiment Analysis
Positioning in wheat futures is balanced, with neither bulls nor bears holding a decisive edge. Neutral sentiment typically precedes a directional catalyst.
Derivatives Intelligence
September 2026 ZW implied volatility at 42.19% (Barchart Aug 21) remains elevated above 32.4% 20-day realised vol, premium consistent with binary event environment and Black Sea uncertainty, but thin agricultural options markets limit directional signal clarity from skew or flow data
Net Assessment
The institutional landscape for wheat price shows greed sentiment. Trend strength is elevated at 8/10, indicating strong directional conviction in current price action. The combination of positioning data, sentiment, and options flow provides context for understanding where smart money is leaning heading into the week.
This analysis covers one dimension. Our full weekly report combines six specialist agents into a single actionable briefing with directional bias, key levels, and risk-opportunity matrix.
Start Free — Get the Market of the WeekFree weekly report · No credit card · Upgrade anytime



