Wheat COT & Institutional Positioning — Smart Money Analysis
Wheat institutional positioning: COT data, sentiment analysis and smart money flow assessment.

Institutional Positioning
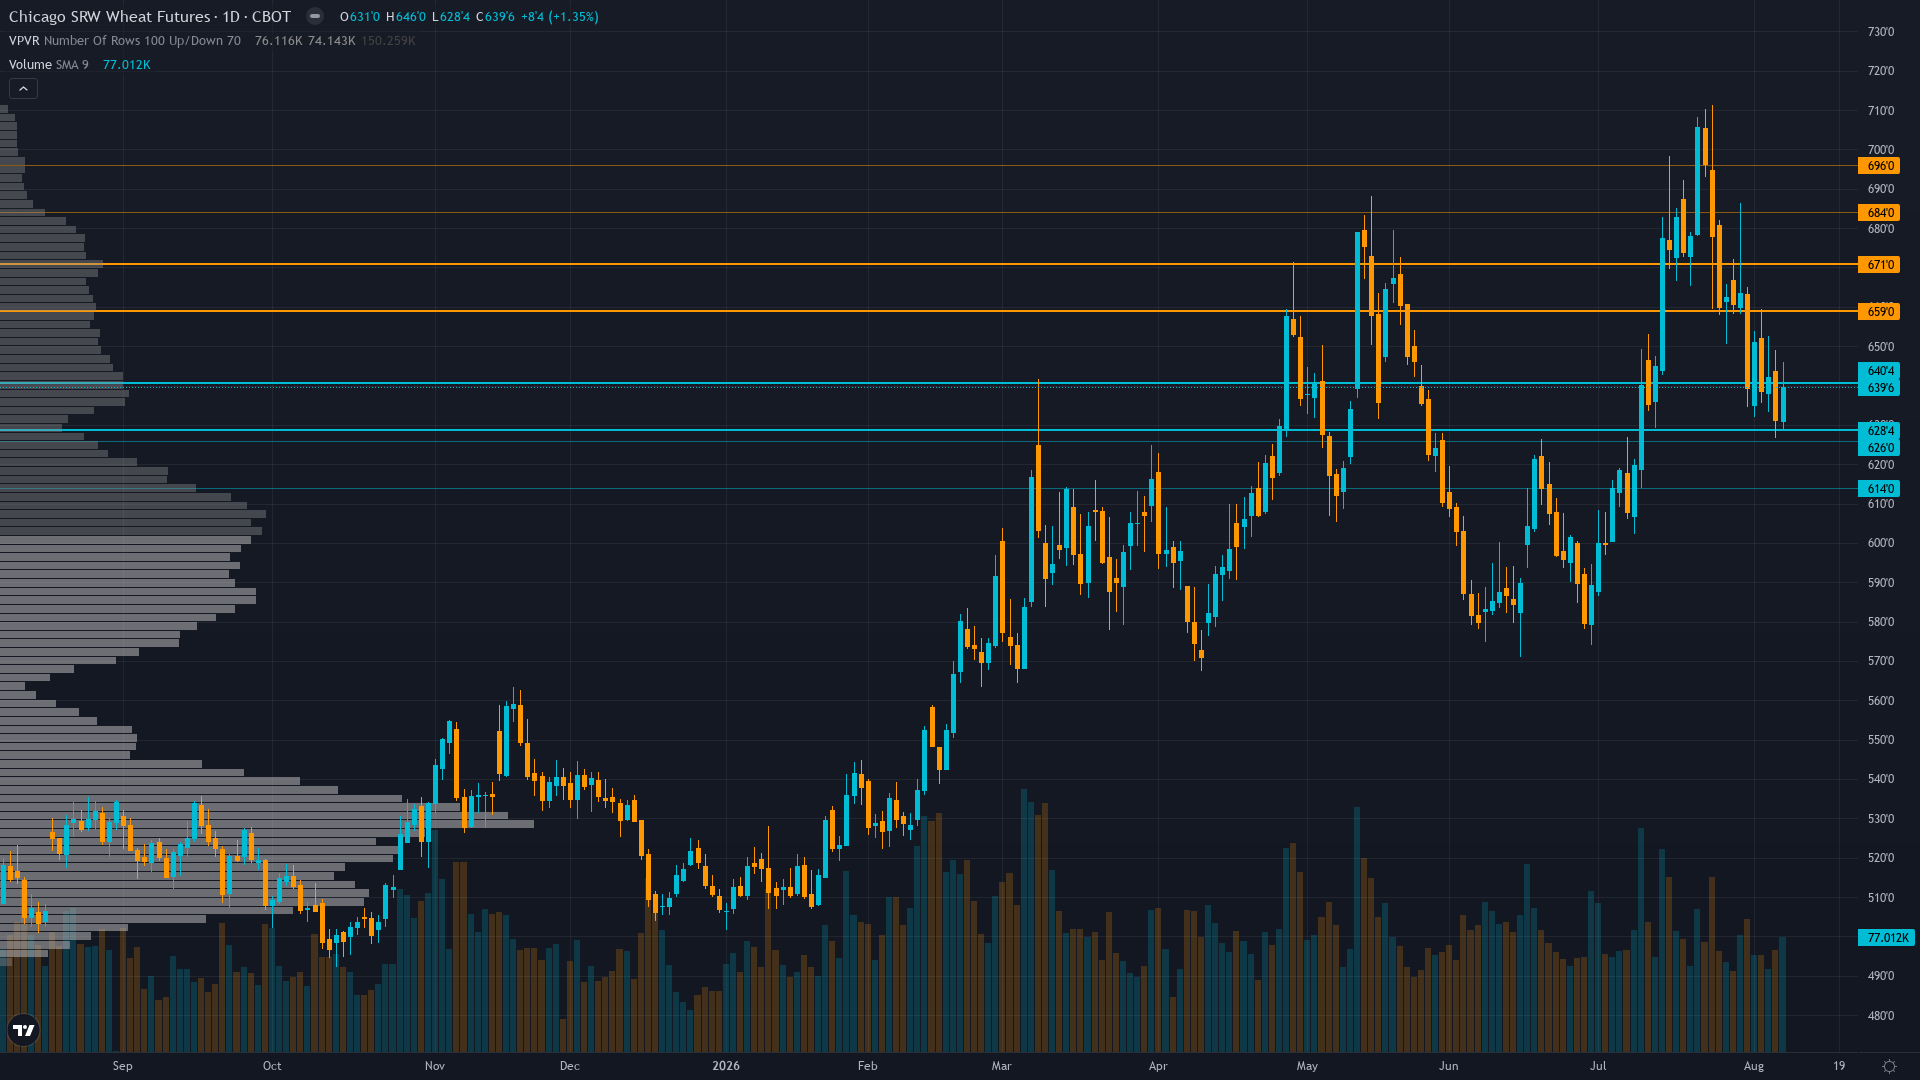
At 643.9, wheat has inched 0.65% higher in a measured advance.
Non-commercials net short -14,759 contracts at 89.9th percentile of 3-year range (CFTC August 4) having added 12,767 shorts last week while commercials net long 16,387 creating extreme divergence ahead of WASDE
Where We Agree & Diverge
Market consensus: Mixed to cautious following July WASDE rally reversal with market viewing seasonal harvest pressure and transient Black Sea premium removal as dominant forces ahead of August 12 WASDE binary event that will determine whether the production catastrophe thesis reasserts or global oversupply narrative prevails
Primary driver: USDA August WASDE binary event 3 days away (August 12, 2026) dominates all other factors with mandatory -2 conviction penalty creating analytical caution despite fundamentally bullish cross-currents from tightening U.S. supply (smallest crop since 1972), extreme institutional net short positioning at 89.9th percentile creating squeeze potential, and technical bounce from 628.60 four-week low
Consensus Gaps
Desk sees mild bullish lean in a market that is predominantly bearish-positioned (managed money at 89.9th percentile shorts) ahead of WASDE binary event, creating moderate divergence where institutional positioning extreme and fundamental supply tightness are underweighted by consensus, but conviction constraints from miss history and WASDE proximity limit divergence magnitude
Sentiment Analysis
Positioning in wheat futures is balanced, with neither bulls nor bears holding a decisive edge. Neutral sentiment typically precedes a directional catalyst.
Derivatives Intelligence
September 2026 implied volatility at 42.19% versus 20-day realised vol of 37.8% indicating elevated two-way premium consistent with WASDE binary event environment but thin agricultural options markets limit directional signal clarity
Net Assessment
The institutional landscape for wheat price shows neutral sentiment. Trend strength sits at 4/10, reflecting moderate directional pressure without clear dominance. The combination of positioning data, sentiment, and options flow provides context for understanding where smart money is leaning heading into the week.
This analysis covers one dimension. Our full weekly report combines six specialist agents into a single actionable briefing with directional bias, key levels, and risk-opportunity matrix.
Start Free — Get the Market of the WeekFree weekly report · No credit card · Upgrade anytime



