Wheat COT & Institutional Positioning — Smart Money Analysis
Wheat institutional positioning: COT data, sentiment analysis and smart money flow assessment.

Institutional Positioning
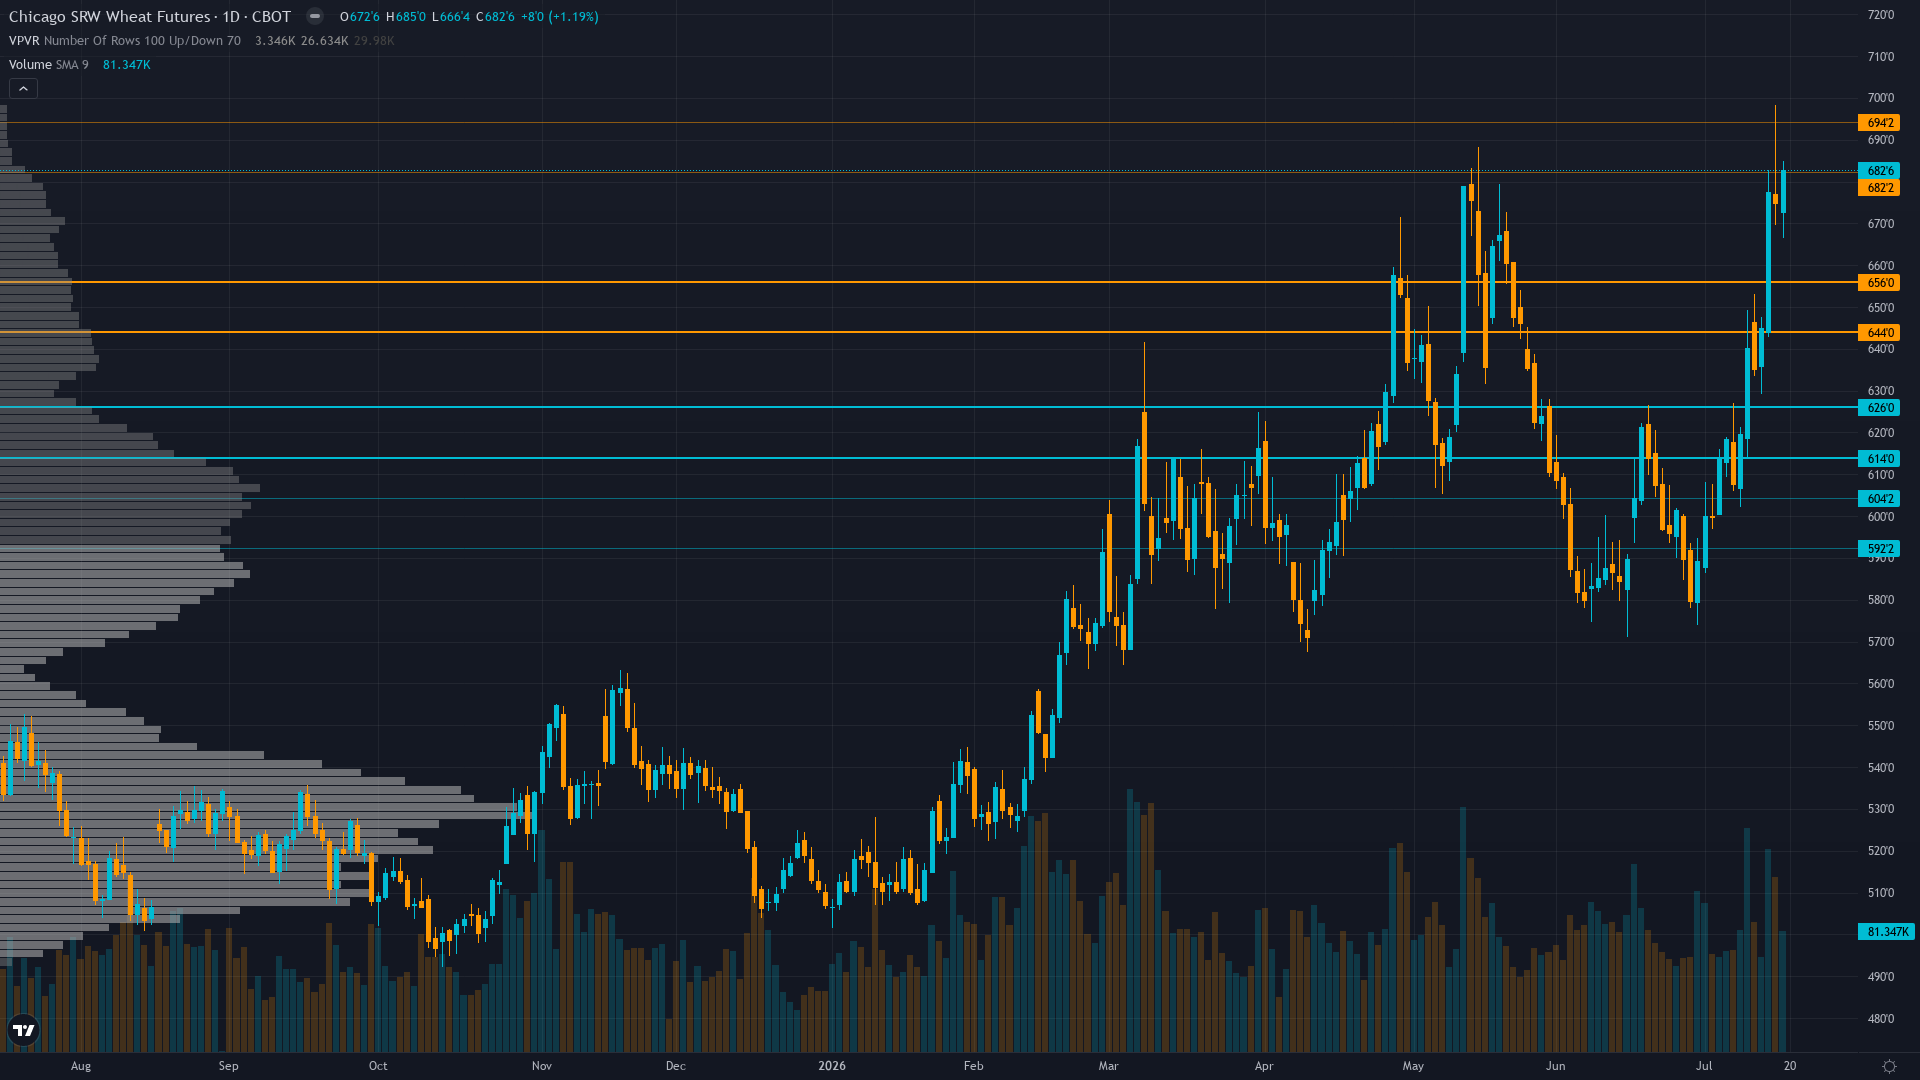
wheat stands at 701.5, having rallied 4.08% as bulls press their advantage.
Managed money executed largest single-week bearish positioning shift on record (back to 2006) swinging from net long +8,729 contracts to net short -34,887 contracts representing -43,616 contract change (10.2% of open interest) as of July 14 COT data, removing squeeze fuel yet creating classic contrarian setup where specs are maximally short against worst U.S. production since 1972 presenting asymmetric short-covering risk if August WASDE confirms additional production downgrades
Crowd Psychology
Neither side has committed heavily to wheat futures, leaving sentiment in a neutral zone that offers little directional guidance on its own.
Options Flow
Implied volatility at 30.87% for July 2026 options reflects moderate two-way risk in normal range for agricultural commodities yet thin wheat options markets with limited liquidity provide minimal directional signal with insufficient put/call ratio data and no notable unusual activity identified limiting options intelligence contribution to directional bias formation beyond confirming elevated but not extreme volatility environment
Market Consensus vs Our Analysis
Market consensus: Cautiously bullish on July 10 WASDE production shock confirming most severe U.S. wheat shortfall since 1972 with crop conditions at 26% good-to-excellent driving prices to May 2024 highs, yet increasingly concerned about sustainability above 700 given managed money record bearish positioning shift, global stocks at 275.0 MMT (34.52% stocks-to-use ratio), and approaching seasonal June-August harvest pressure creating expectation for consolidation in 685-715 range
Primary driver: July 10 WASDE (9 days ago) confirmed catastrophic U.S. winter wheat production at 1,536 million bushels (down 23% YoY, smallest crop since 1972) with only 26% crop rated good-to-excellent versus 46% last year, yet managed money executed historic bearish positioning shift to net short -34,887 contracts (from net long +8,729) creating profound fundamental-institutional divergence where production catastrophe meets record spec shorts at 10.2% of open interest
Putting It Together
In summary, the positioning picture for wheat reflects neutral conviction levels set against a breaking out market backdrop. With trend strength at 8/10, the prevailing move carries significant force behind it. The interplay between smart money activity, retail sentiment, and options market signals will shape how this positioning resolves.
This analysis covers one dimension. Our full weekly report combines six specialist agents into a single actionable briefing with directional bias, key levels, and risk-opportunity matrix.
Start Free — Get the Market of the WeekFree weekly report · No credit card · Upgrade anytime



