TRANSITIONAL MACRO REGIME WITH VIX AT 16.41 (NEUTRAL ZONE BELOW 20 THRESHOLD) INDICATING CALM EQUITY MARKETS, USD AT 101.37 DXY SHOWING STRENGTH CREATING EXPORT COMPETITIVENESS HEADWIND FOR U.S. WHEAT VERSUS BLACK SEA SUPPLIERS, CRUDE OIL ELEVATED YET DECLINING EASING INPUT COSTS, CREATING MIXED CROSS-CURRENTS WHERE IMPROVING RISK APPETITE CLASHES WITH COMMODITY-SPECIFIC SUPPLY-DEMAND FUNDAMENTALS ALLOWING AGRICULTURAL DRIVERS TO DOMINATE DIRECTIONAL DYNAMICS
Smart Money Positioning
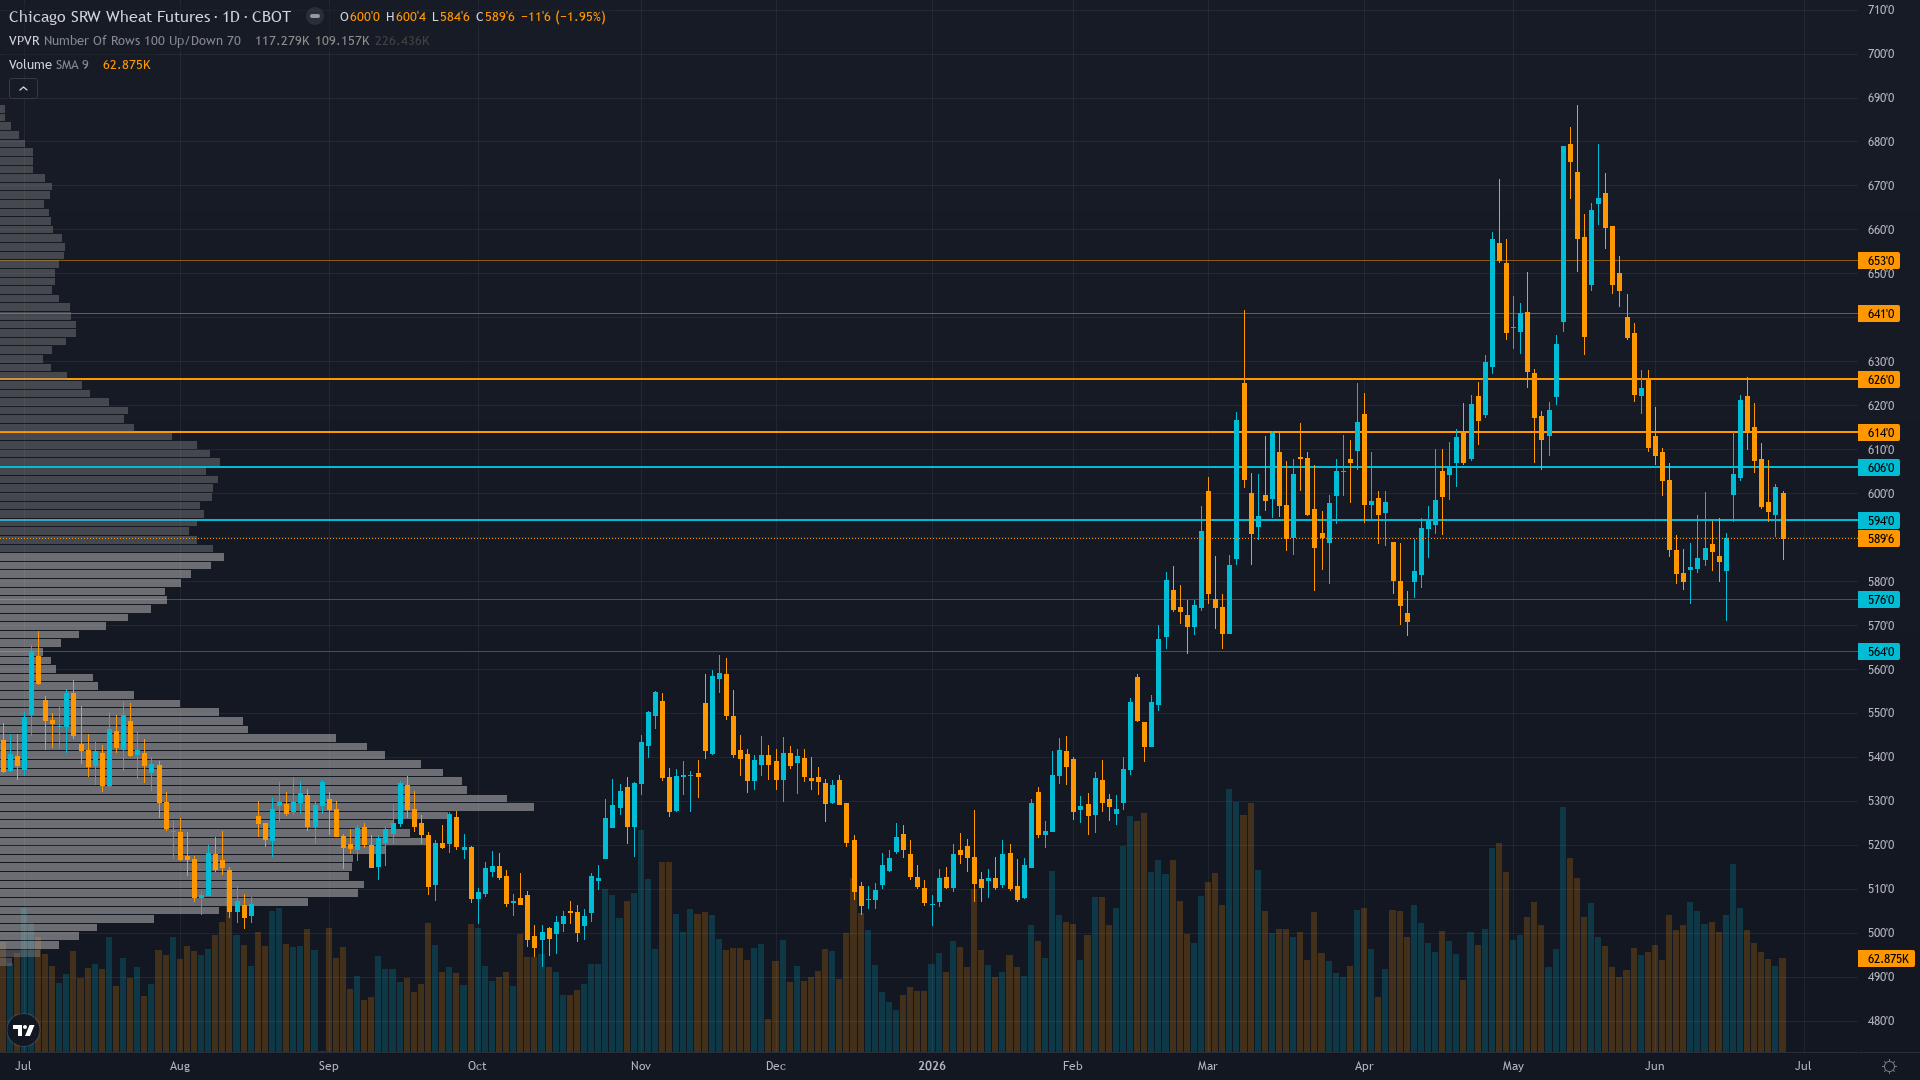
Trading at 588.75 after a 1.87% slide, wheat faces sustained selling interest.
Managed money at historic net short -77,593 contracts (June 9 COT) representing largest bearish positioning extreme on record since 2006, removing downside squeeze fuel yet creating balanced two-way risk without positioning extreme after 84% of February peak shorts already covered
Sentiment & Positioning
Sentiment around wheat futures is neutral, with no extreme positioning on either side. This balanced state often resolves when a catalyst breaks the equilibrium.
Options Market Signal
Implied volatility at 30.87% for July 2026 options reflects moderate two-way risk in normal range for agricultural commodities yet thin wheat options markets provide minimal directional signal with no notable skew or unusual flow identified limiting options intelligence value
Where We Agree & Diverge
Market consensus: Mixed to bearish following June 11 WASDE production shock that has been fully priced with market viewing U.S. supply destruction as insufficient to overcome global stocks at 951.5 million tonnes (34.52% stocks-to-use ratio) expecting seasonal June-August harvest pressure to drive prices toward 570-580 support as structural oversupply narrative dominates despite catastrophic domestic production data
Primary driver: MANDATORY NEUTRAL RESET per Rule 5 after 3 consecutive missed directional calls (June 26 BULLISH missed -3.66%, June 19 NO CALL missed +3.65%, June 12 BEARISH missed +0.86%) - thesis under review before resuming directional analysis on ZW wheat futures
Net Assessment
The institutional landscape for wheat price shows neutral sentiment. Trend strength is low at 3/10, indicating weak directional conviction and potential for range-bound behaviour. The combination of positioning data, sentiment, and options flow provides context for understanding where smart money is leaning heading into the week.
Consensus vs Reality
Last Week's Consensus
“Cautiously neutral to mildly bearish following June 11 WASDE rally failure with market viewing advance from 570 to current 611 as technical bounce within structural range expecting seasonal June-August harvest pressure to cap upside near 620 resistance as global oversupply at 275.0 MMT stocks provides structural buffer against U.S. regional drought concerns”
▼
What Actually Happened
-3.66%
611.1 → 588.75
Common Questions
Where is Wheat heading this week?
Mixed to bearish following June 11 WASDE production shock that has been fully priced with market viewing U.S. supply destruction as insufficient to overcome global stocks at 951.5 million tonnes (34.52% stocks-to-use ratio) expecting seasonal June-August harvest pressure to drive prices toward 570-580 support as structural oversupply narrative dominates despite catastrophic domestic production data
What catalysts are affecting Wheat price action?
MANDATORY NEUTRAL RESET per Rule 5 after 3 consecutive missed directional calls (June 26 BULLISH missed -3.66%, June 19 NO CALL missed +3.65%, June 12 BEARISH missed +0.86%) - thesis under review before resuming directional analysis on ZW wheat futures
How volatile is Wheat right now?
Current Wheat volatility sits at the 68th percentile of its 90-day range. The regime is high with a stable trend across timeframes (5d: 30%, 20d: 32.5%, 60d: 27.5%).
What does historical seasonal data show for Wheat?
Wheat enters June 2026 with a bullish seasonal tendency (65% win rate historically). Winter wheat harvest begins, weather-driven.
What does institutional positioning show for Wheat?
Managed money at historic net short -77,593 contracts (June 9 COT) representing largest bearish positioning extreme on record since 2006, removing downside squeeze fuel yet creating balanced two-way risk without positioning extreme after 84% of February peak shorts already covered
This analysis covers one dimension. Our full weekly report combines six specialist agents into a single actionable briefing with directional bias, key levels, and risk-opportunity matrix.