S&P 500 Key Levels This Week — Support, Resistance & Confluence Zones
S&P 500 key levels breakdown: support zones, resistance zones, confluence and price structure.

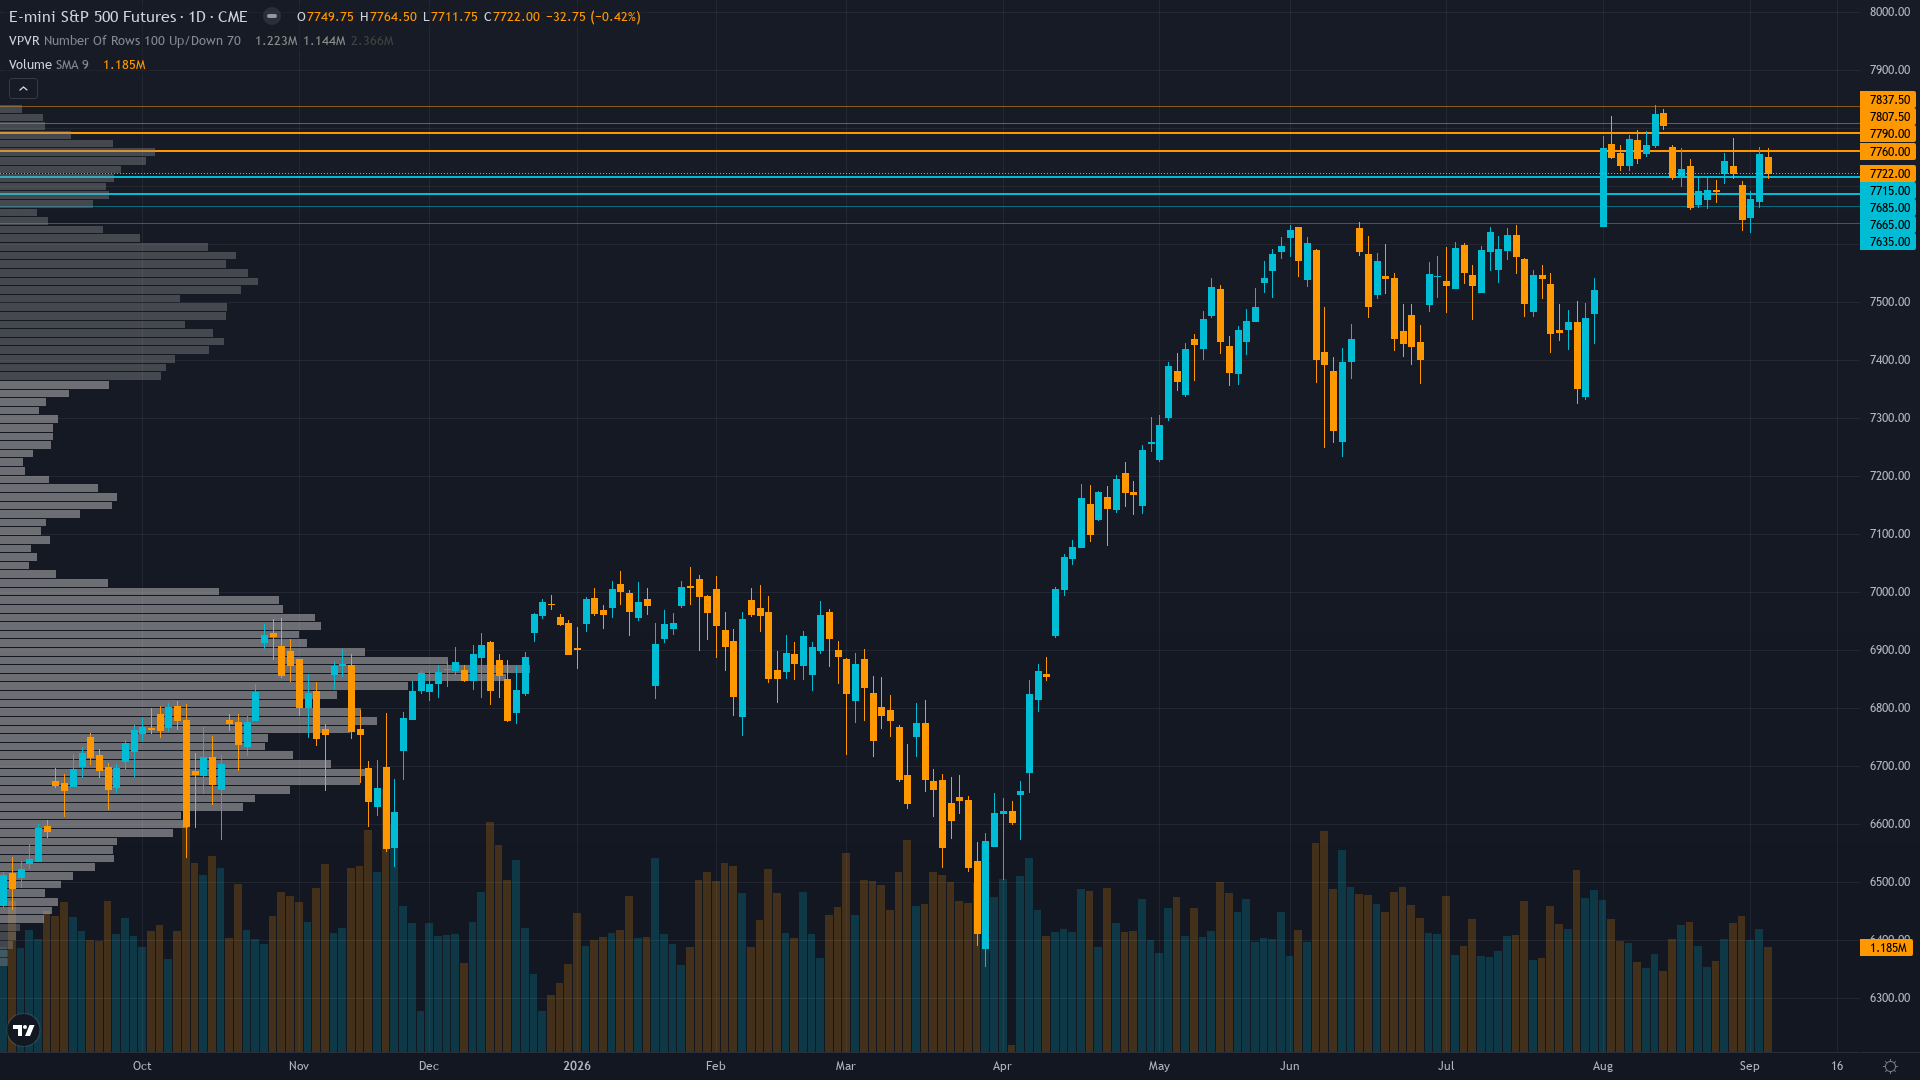
Structural Assessment
S&P 500 sits at 7722 after slipping 0.42% — a shallow pullback rather than a decisive move. S&P 500 futures is consolidating, with price compressing into a narrower range as the market builds energy for its next move.
Daily uptrend intact with ES at 7,722 above 50-day MA (~7,600) and 200-day MA (~7,400), but price remains trapped in 7,680-7,775 consolidation range after failing to sustain above 7,820 ATH resistance two weeks ago, with RSI around 55-60 showing neutral momentum
At 5/10, trend strength is middling — enough to suggest a lean, but not enough to trade with high confidence.
Support Architecture
Support levels for S&P 500 are defined by zones of prior institutional demand. The depth and frequency of prior tests at these levels determines their likely strength.
The strength of support depends on the current ranging regime and volume profile at each level.
Upside Barriers
Resistance levels above SPX futures current price represent zones of historical supply. The significance of each level scales with the number of prior tests and the volume traded there.
The current consolidating regime influences how aggressively these resistance zones are likely to be tested and whether they hold or fold.
Confluence & Methodology
Confluence is the differentiator between a line on a chart and a level worth trading. For S&P 500 futures, the zones with the highest conviction are those validated across technical, institutional, and derivatives dimensions simultaneously.
Low volatility regime suggests 0.4-0.8% daily ES moves (~30-60 points) - current VIX 14.53 prices ~0.9% one-standard-deviation daily moves. The Sep 10-11 PPI/CPI catalyst cluster creates potential for 1.5-2.5% directional expansion on data surprises either direction. Support 7,680 and resistance 7,775 define the consolidation zone.
Beyond Lines on a Chart
Our approach to key levels is designed to filter noise from signal. Six independent agents each assess the same price zones from different perspectives. A level confirmed by one discipline is interesting. A level confirmed by four or five is worth building a trade plan around.
This multi-discipline approach means the levels in our paid reports carry institutional-grade confluence — not just lines on a chart, but zones validated across every analytical dimension that matters.
Our paid reports include specific support and resistance levels identified by six specialist agents — technical structure, institutional positioning, options flow, fundamentals, sentiment, and economic analysis. Not just lines on a chart, but zones validated by multi-discipline confluence.
Start Free — Get the Market of the WeekFree weekly report · No credit card · Upgrade anytime



