S&P 500 Key Levels This Week — Support, Resistance & Confluence Zones
S&P 500 key levels breakdown: support zones, resistance zones, confluence and price structure.

Structural Assessment
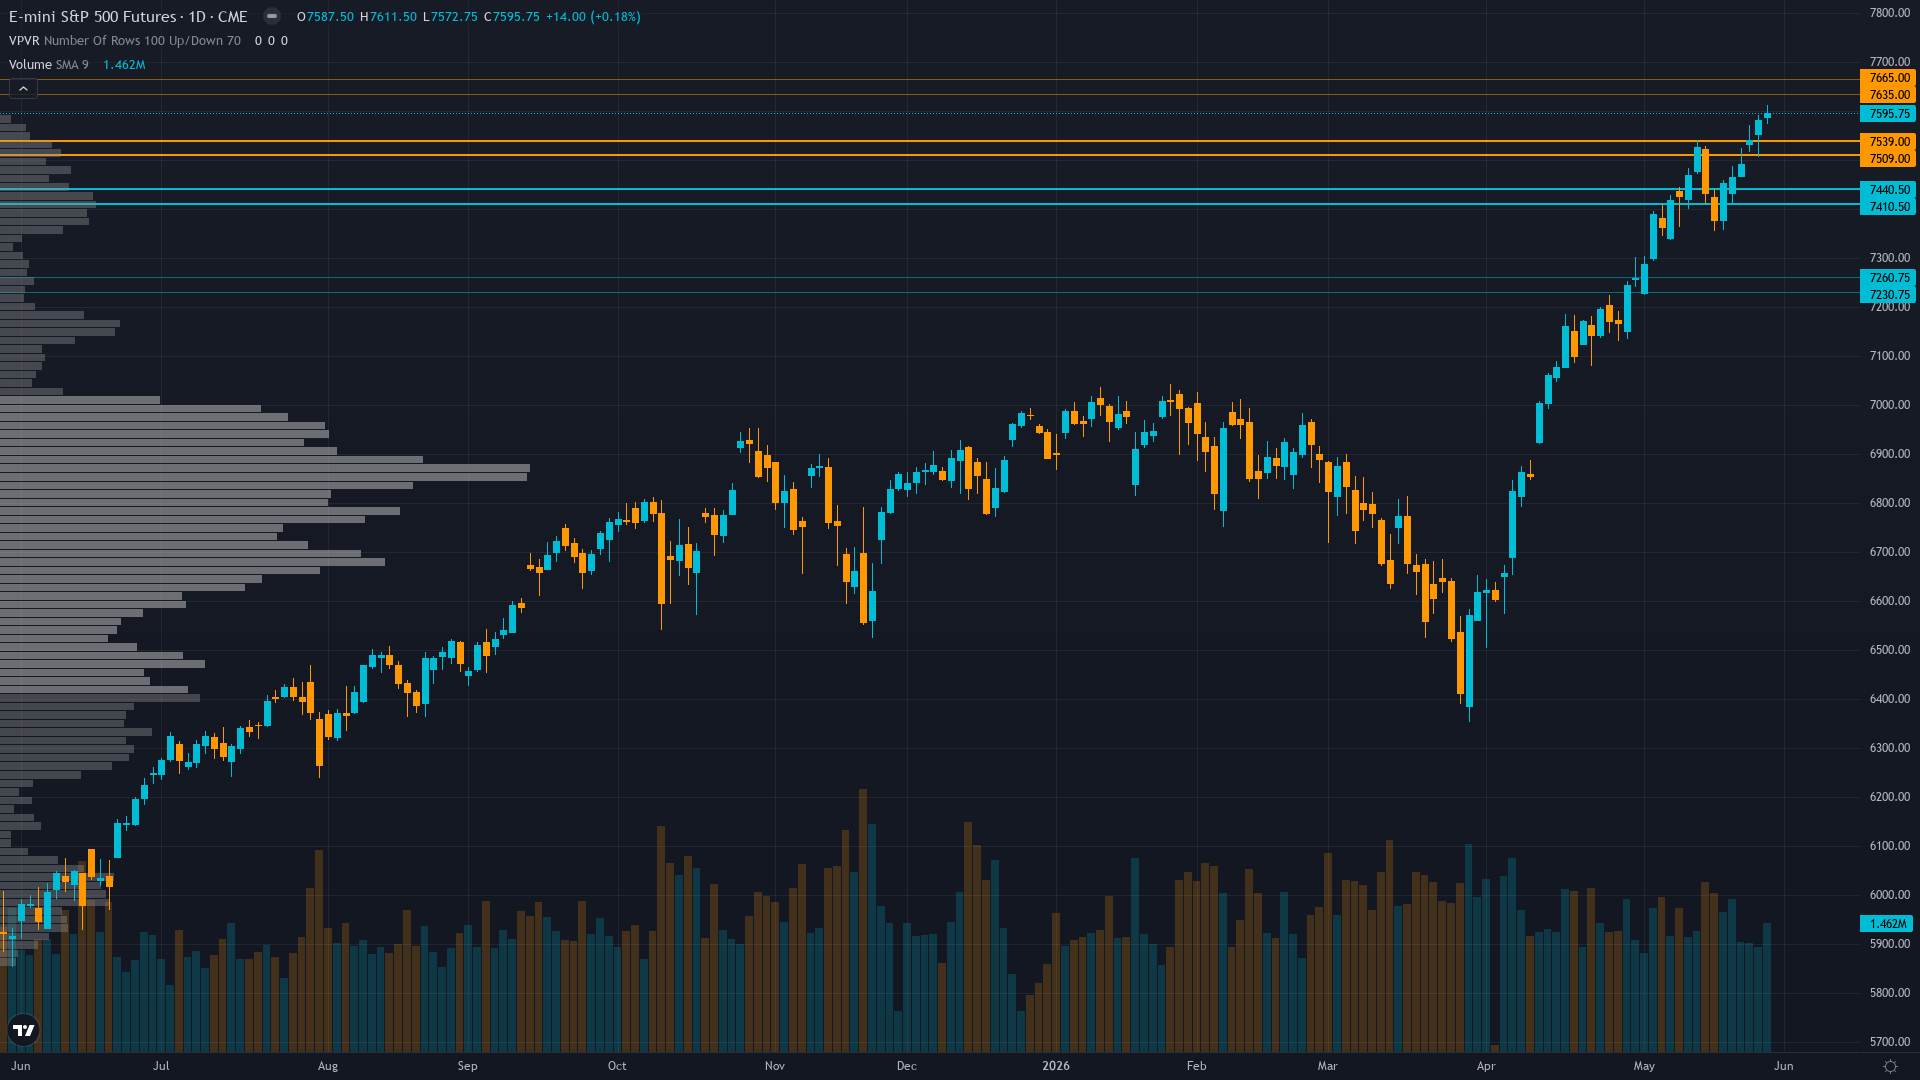
Trading at 7595.75 with a 0.18% uptick, S&P 500 is drifting higher without strong conviction. S&P 500 futures is in a trending up market state, requiring careful assessment of current conditions.
Strong uptrend intact—ES at 7,595.75 decisively above 50-day MA 7,433.36 (+2.2%) and 200-day MA 7,276.11 (+4.4%) with both positively sloped, RSI 63.23 healthy bullish momentum without overbought yet, fresh ATH at 7,611.50 intraday confirming breakout structure continuation
At 8/10, trend strength signals that directional momentum is firmly in control.
Support Architecture
Support levels for S&P 500 are defined by zones of prior institutional demand. The depth and frequency of prior tests at these levels determines their likely strength.
The strength of support depends on the current trending up regime and volume profile at each level.
Upside Barriers
Resistance levels above SPX futures current price represent zones of historical supply. The significance of each level scales with the number of prior tests and the volume traded there.
The current trending up regime influences how aggressively these resistance zones are likely to be tested and whether they hold or fold.
Confluence & Methodology
Confluence is the differentiator between a line on a chart and a level worth trading. For S&P 500 futures, the zones with the highest conviction are those validated across technical, institutional, and derivatives dimensions simultaneously.
Normal volatility regime suggests 1.0-1.5% daily ES moves expected with current session range 7,572.75-7,611.50 representing 0.5% width showing tight consolidation - June 16-17 FOMC binary outcome presents asymmetric expansion risk with potential 2-3% intraday swings on policy surprise either direction
Beyond Lines on a Chart
Our approach to key levels is designed to filter noise from signal. Six independent agents each assess the same price zones from different perspectives. A level confirmed by one discipline is interesting. A level confirmed by four or five is worth building a trade plan around.
This multi-discipline approach means the levels in our paid reports carry institutional-grade confluence — not just lines on a chart, but zones validated across every analytical dimension that matters.
Our paid reports include specific support and resistance levels identified by six specialist agents — technical structure, institutional positioning, options flow, fundamentals, sentiment, and economic analysis. Not just lines on a chart, but zones validated by multi-discipline confluence.
Start Free — Get the Market of the WeekFree weekly report · No credit card · Upgrade anytime