30-Year Treasury Forecast This Week — Outlook, Drivers & Key Levels
This week's 30-Year Treasury outlook: key drivers, volatility context, risk-opportunity assessment and the week ahead.

Market Overview
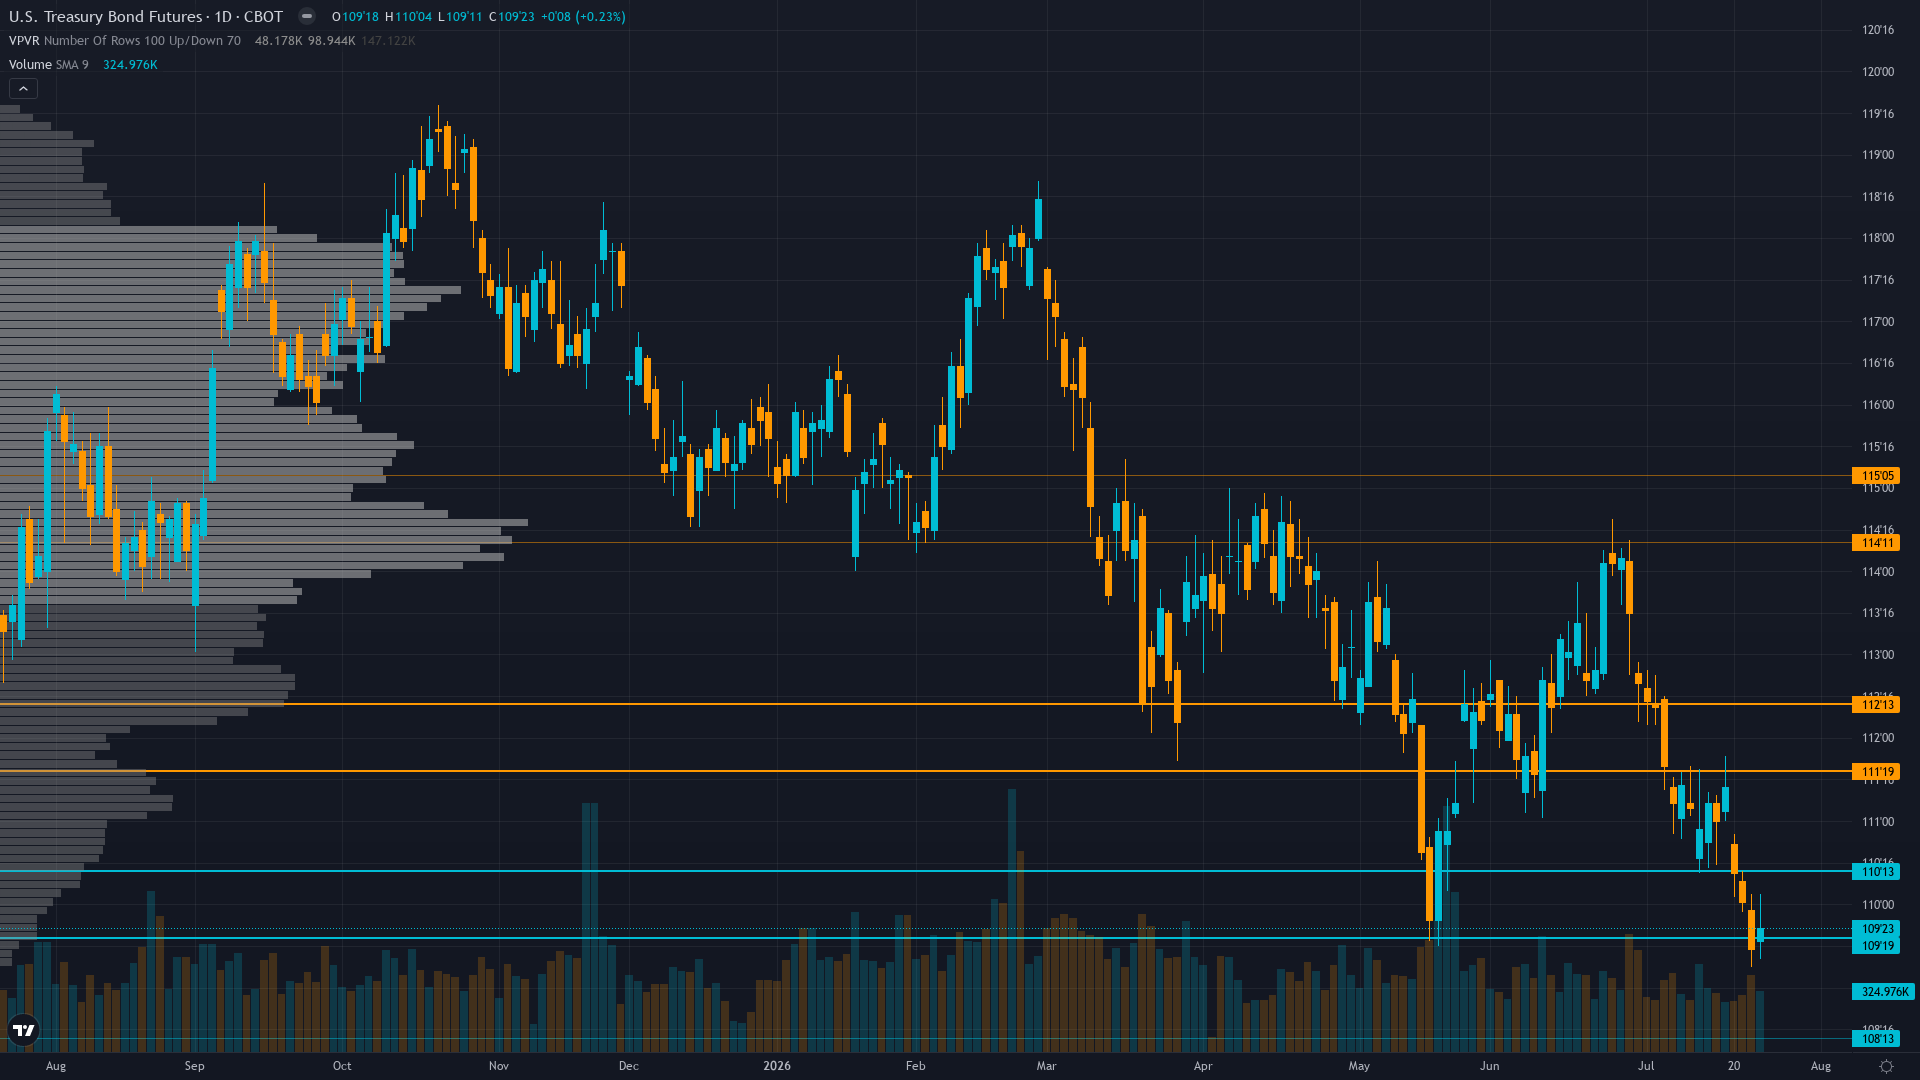
At 109.53, 30-year Treasury has eased 0.79% in a controlled retreat. Treasury bond futures is in a breaking down ahead of binary FOMC catalyst market state, requiring careful assessment of current conditions.
Market pricing 75% hold probability at July 28-29 FOMC maintaining 3.50-3.75% range with 25% hike probability per Polymarket $91.9M volume; bonds consolidating 109-111 range awaiting FOMC clarity on whether June CPI 3.5% dovish surprise shifts forward guidance from June 17 hawkish dot plot with structural deficit supply pressure widely recognized
This Week's Catalysts & Drivers
Primary driver: Last week BULLISH call MISSED with -0.79% decline from 110.625 to 109.75 extending consecutive miss streak to 2 (one away from mandatory reset threshold) while FOMC binary catalyst 3 days forward (July 28-29) creates noise-threshold environment where probable weekly move 0.4-0.5% sits BELOW 0.50% Noise Floor with no fresh information beyond widely-priced dynamics forcing NEUTRAL per Rules 1 and 2
Secondary factor: Cross-discipline conflict with Economic +1.5 confidence 6 citing June CPI 3.5% dovish surprise versus Fundamental -1.2, Technical -1.5, Options -0.5, Sentiment -0.5 creating 1v4 split producing synthesized |signal| of 0.5 falling well BELOW 1.1 Min Signal threshold requiring NO CALL per framework
Additional influence: MOVE volatility spiked to 80 up 16.94% weekly from compressed regime signaling rising term premium and uncertainty yet current price 109'17 (TradingView confirmed July 26) consolidated from last week's breakdown with 3-day void until FOMC creating maximum tactical paralysis where edge over consensus is minimal
Economic backdrop: Fed held June 17 at 3.50-3.75% with next FOMC July 28-29 (3 days away) showing 75% hold/25% hike probability per Polymarket; June CPI released July 14 showed 3.5% YoY dovish surprise down from 4.2% yet market unable to rally bonds suggesting either skepticism about Fed pivot or structural supply dominance; 30Y yield at 5.16% per YCharts July 24 data validates persistent hawkish repricing environment
Fundamental assessment: Fed at 3.50-3.75% with July 28-29 FOMC showing 75% hold probability per Polymarket prediction markets yet June CPI 3.5% YoY dovish surprise from prior 4.2% creates tension between data reality and hawkish June 17 dot plot; FY2026 deficit at $1.4T through June maintains structural supply pressure with yields at 5.16% on 30-year per YCharts (July 24 data)
Technical Picture
Confirmed downtrend since April 7 peak at 114.75 with lower highs and lower lows intact; current 109'17 sits well below 50-day MA and 200-day MA with bearish alignment; TradingView technical rating SELL with declining open interest at 1.84M suggests weakening trend conviction as participants deleverage
At 4/10, trend strength is middling — enough to suggest a lean, but not enough to trade with high confidence.
Bull & Bear Case
Primary risk: July 28-29 FOMC delivers hawkish hold emphasizing June 17 dot plot stance despite June CPI 3.5% dovish surprise, citing transitory energy-driven disinflation or lag effects, maintaining terminal rate expectations elevated and pressuring ZB below 109.0 support toward 107.0 major support with cascade potential representing additional 2-3% decline from current 109.53 levels as 30Y yields push toward 5.30-5.40% range (Probability: medium)
Primary opportunity: July 28-29 FOMC acknowledges June CPI 3.5% dovish surprise by shifting forward guidance from June 17 hawkish stance toward acknowledging disinflation progress, removing rate hike probability from market pricing and triggering violent short covering rally above 111.0 resistance toward 113.0 zone from current washed-out positioning with MOVE at 80 creating asymmetric upside from compressed IV levels (Timeframe: Next 3-5 days through July 28-29 FOMC decision and immediate post-decision repricing if Fed pivots dovish creating potential 2-3% upside move from current 109.53 toward 112-113 resistance zone)
This week's edge: Signal strength below Min Signal threshold—synthesized |signal| at 0.5 falls well short of 1.1 Min Signal requirement mandating NO CALL per Rule 2. Probable weekly move 0.4-0.5% sits at/below 0.50% Noise Floor threshold with 3-day void until July 29 FOMC creating low-information environment where directional call would provide no edge beyond widely-priced Polymarket consensus. Consecutive miss streak at 2 one shy of mandatory reset threshold applying maximum caution. Cross-discipline 1v4 conflict (Economic bullish vs 4 bearish) with Economic measuring only 48% reliability prevents directional clarity. Market has fully priced binary FOMC setup with no fresh catalyst before July 29 decision—issuing directional bias in this environment would be noise-calling not analysis.
Volatility Regime
Volatility for T-bond futures is at the 35th percentile over 90 days — a compressed regime where breakout potential builds beneath the surface. The volatility trend is up, with expansion across timeframes pointing to growing uncertainty in near-term price action.
What to Watch
The FOMC policy decision July 28-29 with statement 2:00 PM ET July 29 and press conference 2:30 PM ET; Polymarket shows 75% no-change probability maintaining 3.50-3.75% range with 25% hike probability; no SEP/dot plot this meeting reducing informational content yet forward guidance critical given June 17 hawkish pivot contradicted by June 14 CPI 3.5% dovish surprise creating binary catalyst for duration repricing on Wednesday 29 July stands as the week's primary risk event — high-impact and capable of overriding the existing technical and sentiment setup.
The interplay between breaking down ahead of binary FOMC catalyst market conditions and upcoming catalysts will define this week's trading landscape for ZB futures.
This analysis covers one dimension. Our full weekly report combines six specialist agents into a single actionable briefing with directional bias, key levels, and risk-opportunity matrix.
Start Free — Get the Market of the WeekFree weekly report · No credit card · Upgrade anytime



