S&P 500 Forecast This Week — Outlook, Drivers & Key Levels
This week's S&P 500 outlook: key drivers, volatility context, risk-opportunity assessment and the week ahead.

Where Things Stand
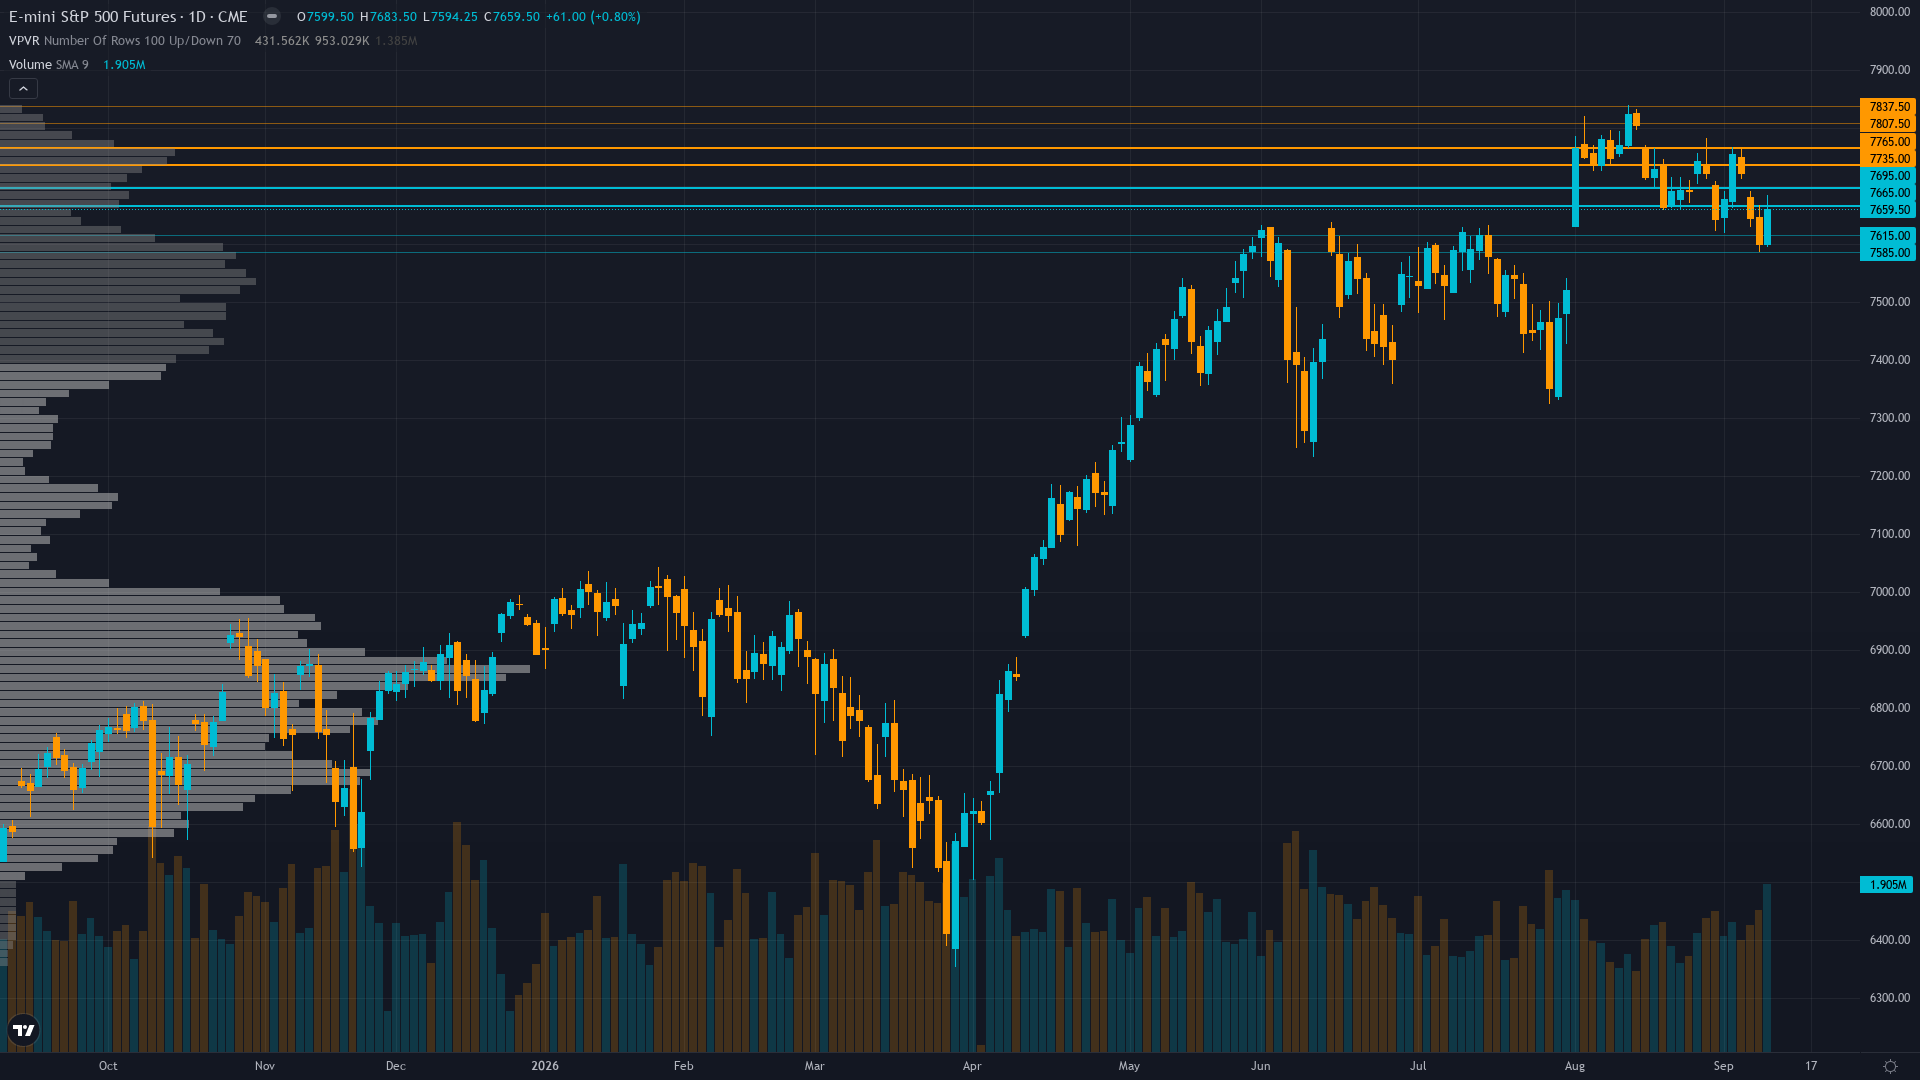
S&P 500 sits at 7659.5 after a 0.80% gain — a quiet move higher without aggressive momentum. S&P 500 futures is consolidating, with price compressing into a narrower range as the market builds energy for its next move.
Cautiously bearish as ES consolidates below 50-day MA with narrowing breadth, rising yields, and fading buyback support ahead of FOMC Economic Projections Sep 16 that could validate or challenge the current policy trajectory
What's Driving Price
Primary driver: ES consolidates at 7,659.5 after CPI matched expectations (+0.86% on Sep 11) but weekly loss of -1.23% persists as 10-year yield surged 18bp to 4.96%, oil price pressures and rapidly narrowing sector breadth create downside momentum ahead of dense Sep 15-16 catalyst cluster
Secondary factor: CFTC COT data Sep 8 shows non-commercial net short at -76,036 contracts (54.4 percentile) with minimal weekly change of -95 contracts — speculative shorts have stabilized at moderate levels with no fresh catalyst to trigger aggressive covering or additional building, removing the powerful short-squeeze asymmetry that dominated August setups
Additional influence: September seasonal headwinds intensify during historically weakest two-week stretch: Sep 15-30 averages -0.91% return since 1928, corporate buyback demand peaked around Sep 8 and is now fading through month-end, while Sep 18 ES futures roll and Sep 16 FOMC Economic Projections converge in a dense event window
Economic backdrop: Fed at 3.63% with Sep 16 FOMC Economic Projections (Wed) and Aug Retail Sales (est +0.9% vs -0.6% prior) as high-impact catalysts; 10Y yield at 4.96% up 18bp in a week pressuring equity multiples; inflation stable at 2.36%, unemployment 4.1%
Fundamental assessment: Forward P/E 19.7x on $389.90 forward EPS suggests ~22% undervaluation versus historical 25.4x average; 2026 earnings growth of 32% driven by AI infrastructure; Q3 earnings season begins October as next validation point
Chart Assessment
Daily trend bearish with ES at 7,659.5 trading below 50-day MA (~7,700) after -1.23% weekly decline; RSI ~45-50 neutral with no divergence; 7,600 immediate support and 7,700 resistance define consolidation; break below 7,590 opens test of 7,500
With trend strength at 4/10, the directional signal is present but far from decisive.
Volatility Context
At the 18th percentile, ES futures volatility is unusually subdued, creating conditions that historically precede sharp directional moves. Realised vol is declining steadily, compressing into ranges that tend to snap when a catalyst breaks the equilibrium.
Low volatility regime suggests 0.5-0.9% daily ES moves (~38-69 points range) — current VIX 15.84 prices ~1.0% one-standard-deviation daily move. The dense FOMC/Retail Sales catalyst cluster Sep 15-16 creates potential for 1.5-3.0% directional expansion on policy surprises. Support immediate 7,590 and resistance 7,700 define the current consolidation zone, with the 7,500-7,600 major support zone and 7,822.5 ATH defining the broader range
Upside & Downside
Primary risk: Hawkish FOMC Economic Projections on Sep 16 (dot plot revision higher, higher terminal rate) combined with fading buyback support and September seasonal weakness could drive ES below 7,500 major support as VIX expands from compressed 15.84 levels (Probability: medium)
Primary opportunity: Retail Sales (Aug) on Sep 16 beats consensus of +0.9% MoM and FOMC maintains accommodative projections, validating soft-landing narrative and triggering short-covering rally from -76,036 contract net short position back toward 7,700-7,800 (Timeframe: September 16-25 2026)
This week's edge: Signal below Min Signal threshold — directional edge insufficient for bias. The market may be underweighting the asymmetry created by compressed VIX at 15.84 ahead of the Sep 15-16 FOMC/Retail Sales catalyst cluster in the historically weakest seasonal window, where the options market's negative gamma exposure of -$16.6B could amplify any post-catalyst directional move, while simultaneously over-extrapolating the September 'worst month' narrative despite the Benzinga analysis showing 2026's positive August and 10-17.5% YTD range has historically produced above-average September returns (+1.0%) since WWII
The Week Ahead
The NY Empire State Manufacturing Index (Sep) est 15 vs prior 20.6 — first September manufacturing read on Tuesday 15 September represents a mid-tier catalyst that could accelerate or stall the current directional thesis.
How S&P 500 navigates the confluence of consolidating conditions and incoming data will determine whether the current directional thesis holds or breaks.
This analysis covers one dimension. Our full weekly report combines six specialist agents into a single actionable briefing with directional bias, key levels, and risk-opportunity matrix.
Start Free — Get the Market of the WeekFree weekly report · No credit card · Upgrade anytime



