S&P 500 Forecast This Week — Outlook, Drivers & Key Levels
This week's S&P 500 outlook: key drivers, volatility context, risk-opportunity assessment and the week ahead.

Where Things Stand
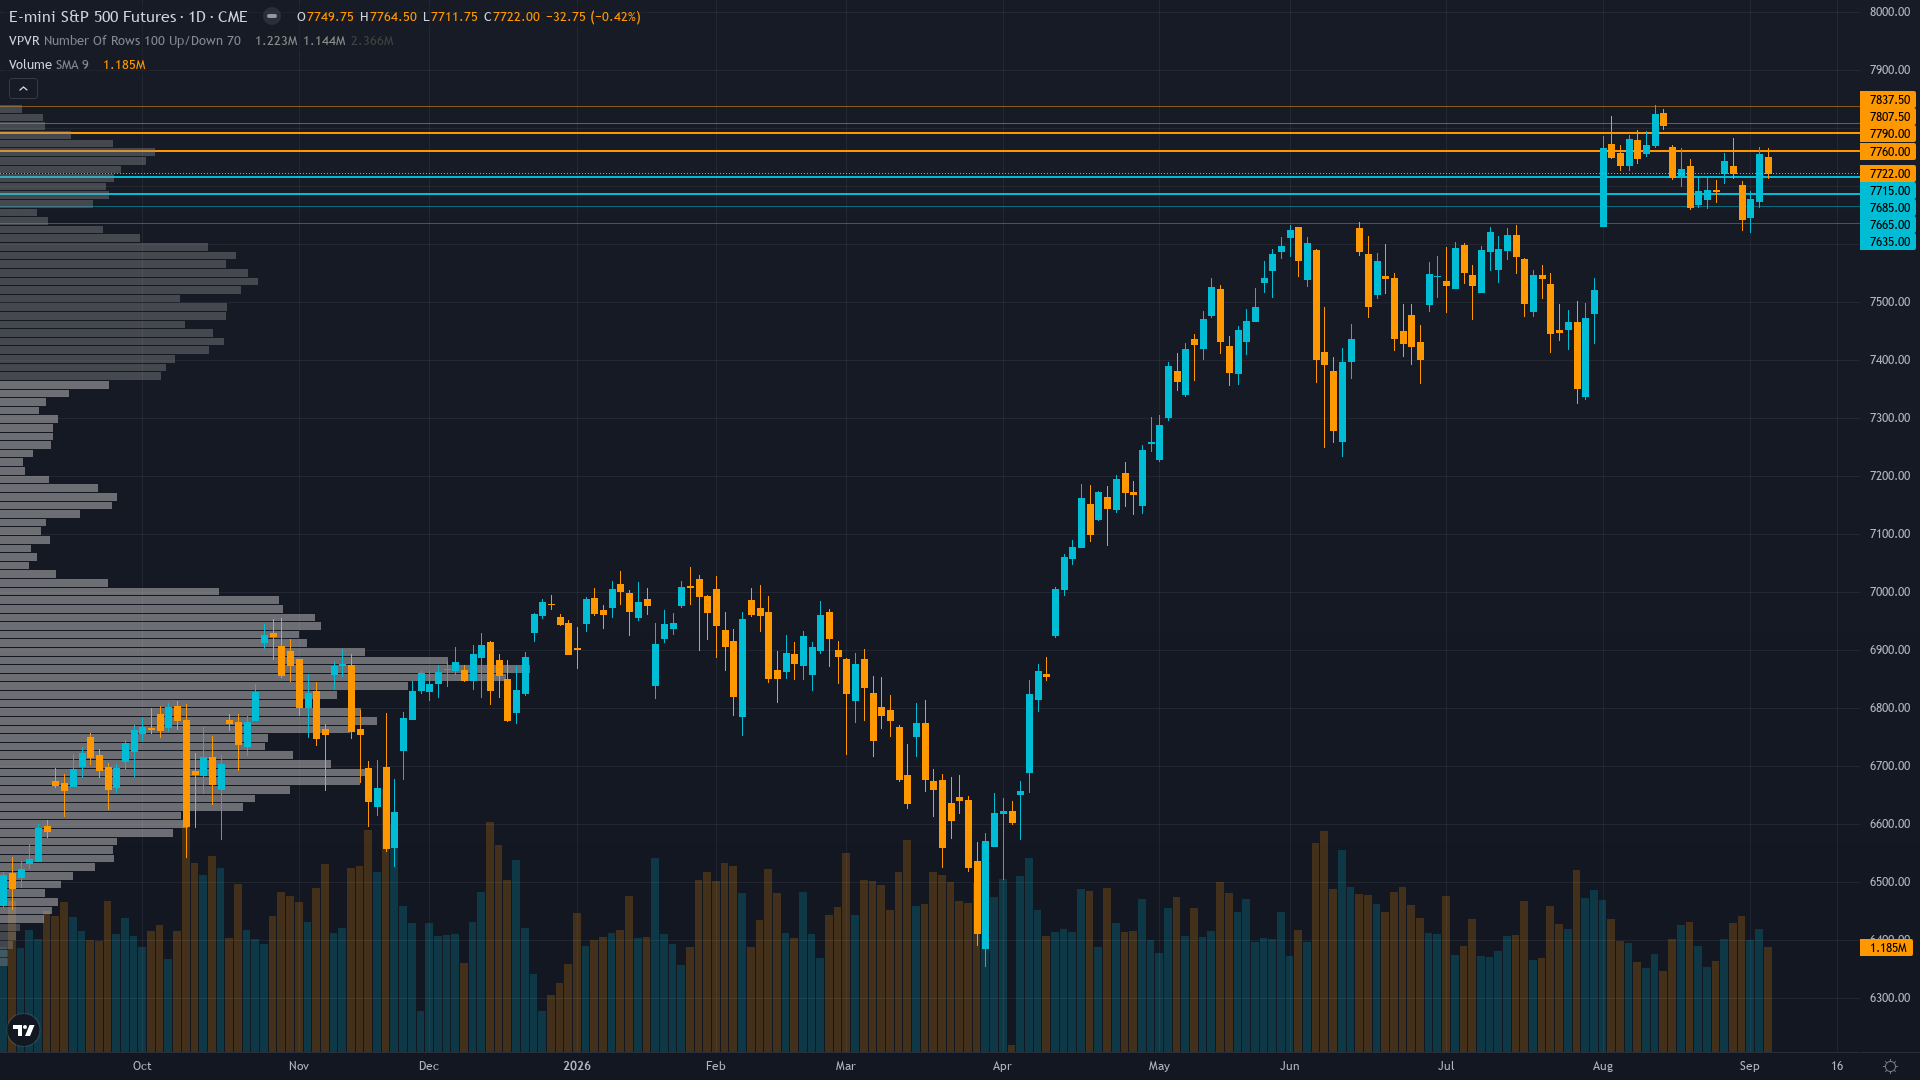
Trading at 7722 with a 0.42% dip, S&P 500 is giving back ground gradually. S&P 500 futures is consolidating, with price compressing into a narrower range as the market builds energy for its next move.
Cautiously neutral-to-slightly-bullish as ES consolidates in tight range near ATH resistance, awaiting PPI/CPI catalysts Sep 10-11 to determine whether the disinflation narrative holds or whether September seasonal weakness materializes
What's Driving Price
Primary driver: ES consolidates at 7,722 after a near-flat week (-0.06%) as the September seasonally weak month begins with the index trapped between 7,680 support and 7,775 resistance, awaiting the dense PPI/CPI catalyst cluster Sep 10-11 that will test whether stable inflation narrative holds ahead of September FOMC
Secondary factor: CFTC COT data Sep 1 shows non-commercial net short at -75,941 contracts (55.1 percentile) after a further -7,947 contract increase in bearish positioning from prior week's -67,994, extending the speculative short build now totaling -65,381 contracts over two weeks, maintaining short-covering squeeze potential but at a less extreme percentile than prior weeks
Additional influence: September seasonality creates a nuanced backdrop: S&P 500 historically averages -1.1% in September (worst month), yet 2026 enters the month with August positive (+0.4%) and YTD gains in the 10-17.5% range where September has historically averaged +1.0% since WWII with only 1 loss in 11 comparable instances, creating conflicting seasonal signals that reduce directional conviction
Economic backdrop: Fed on hold at 3.63% with inflation stable at 2.35%, unemployment 4.1%, markets pricing steady policy through September FOMC - PPI MoM Aug (est 0.3% vs 0%) and CPI Aug (Sep 11) represent the week's key catalysts that could challenge or validate the stable inflation narrative
Fundamental assessment: Forward P/E 26.13 modestly above long-term average but supported by 23-24% earnings growth for 2026 and exceptional Q2 results (50.4% growth, 85% beat rate) - valuation is a secondary concern absent earnings disappointment
Chart Assessment
Daily uptrend intact with ES at 7,722 above 50-day MA (~7,600) and 200-day MA (~7,400), but price remains trapped in 7,680-7,775 consolidation range after failing to sustain above 7,820 ATH resistance two weeks ago, with RSI around 55-60 showing neutral momentum
With trend strength at 5/10, the directional signal is present but far from decisive.
Risk & Opportunity
Primary risk: PPI or CPI prints above consensus (PPI >0.3%, CPI >334.14), challenging the stable inflation narrative and triggering repricing of Fed expectations, with compressed VIX at 14.53 creating asymmetric vol expansion that could push ES through 7,680 support toward 7,600 (Probability: medium)
Primary opportunity: PPI and CPI both print in line or below consensus, confirming disinflation trend and validating current Fed on-hold pricing, enabling ES to break above 7,775 resistance toward retest of 7,822.5 ATH as compressed VIX and moderate short positioning provide upside fuel (Timeframe: September 10-18 2026)
This week's edge: Signal below Min Signal threshold - directional edge insufficient for bias. The market may be underweighting the asymmetric vol expansion risk from compressed VIX at 14.53 ahead of the Sep 10-11 PPI/CPI catalyst cluster in the historically weakest seasonal month, while the September seasonal pattern for strong YTD years (averaging +1.0% in 11 comparable instances since WWII) conflicts with the headline -1.1% September average, creating genuine two-way risk rather than clear directional edge
Volatility Backdrop
ES futures sits in a low-volatility regime (15th percentile), where the calm surface often masks building pressure. Volatility contraction continues, building the stored energy that typically precedes the next significant directional move.
Low volatility regime suggests 0.4-0.8% daily ES moves (~30-60 points) - current VIX 14.53 prices ~0.9% one-standard-deviation daily moves. The Sep 10-11 PPI/CPI catalyst cluster creates potential for 1.5-2.5% directional expansion on data surprises either direction. Support 7,680 and resistance 7,775 define the consolidation zone.
The Week Ahead
PPI MoM (Aug) release - estimate 0.3% vs previous 0.0% - first major inflation data point of the week, followed by CPI (Aug) on Sep 11 (est 334.14 vs 332.81), testing whether producer prices rebound from July's zero reading on Thursday 10 September is a high-impact catalyst with the potential to redefine the near-term outlook entirely.
How S&P 500 navigates the confluence of consolidating conditions and incoming data will determine whether the current directional thesis holds or breaks.
This analysis covers one dimension. Our full weekly report combines six specialist agents into a single actionable briefing with directional bias, key levels, and risk-opportunity matrix.
Start Free — Get the Market of the WeekFree weekly report · No credit card · Upgrade anytime



