S&P 500 Forecast This Week — Outlook, Drivers & Key Levels
This week's S&P 500 outlook: key drivers, volatility context, risk-opportunity assessment and the week ahead.

Where Things Stand
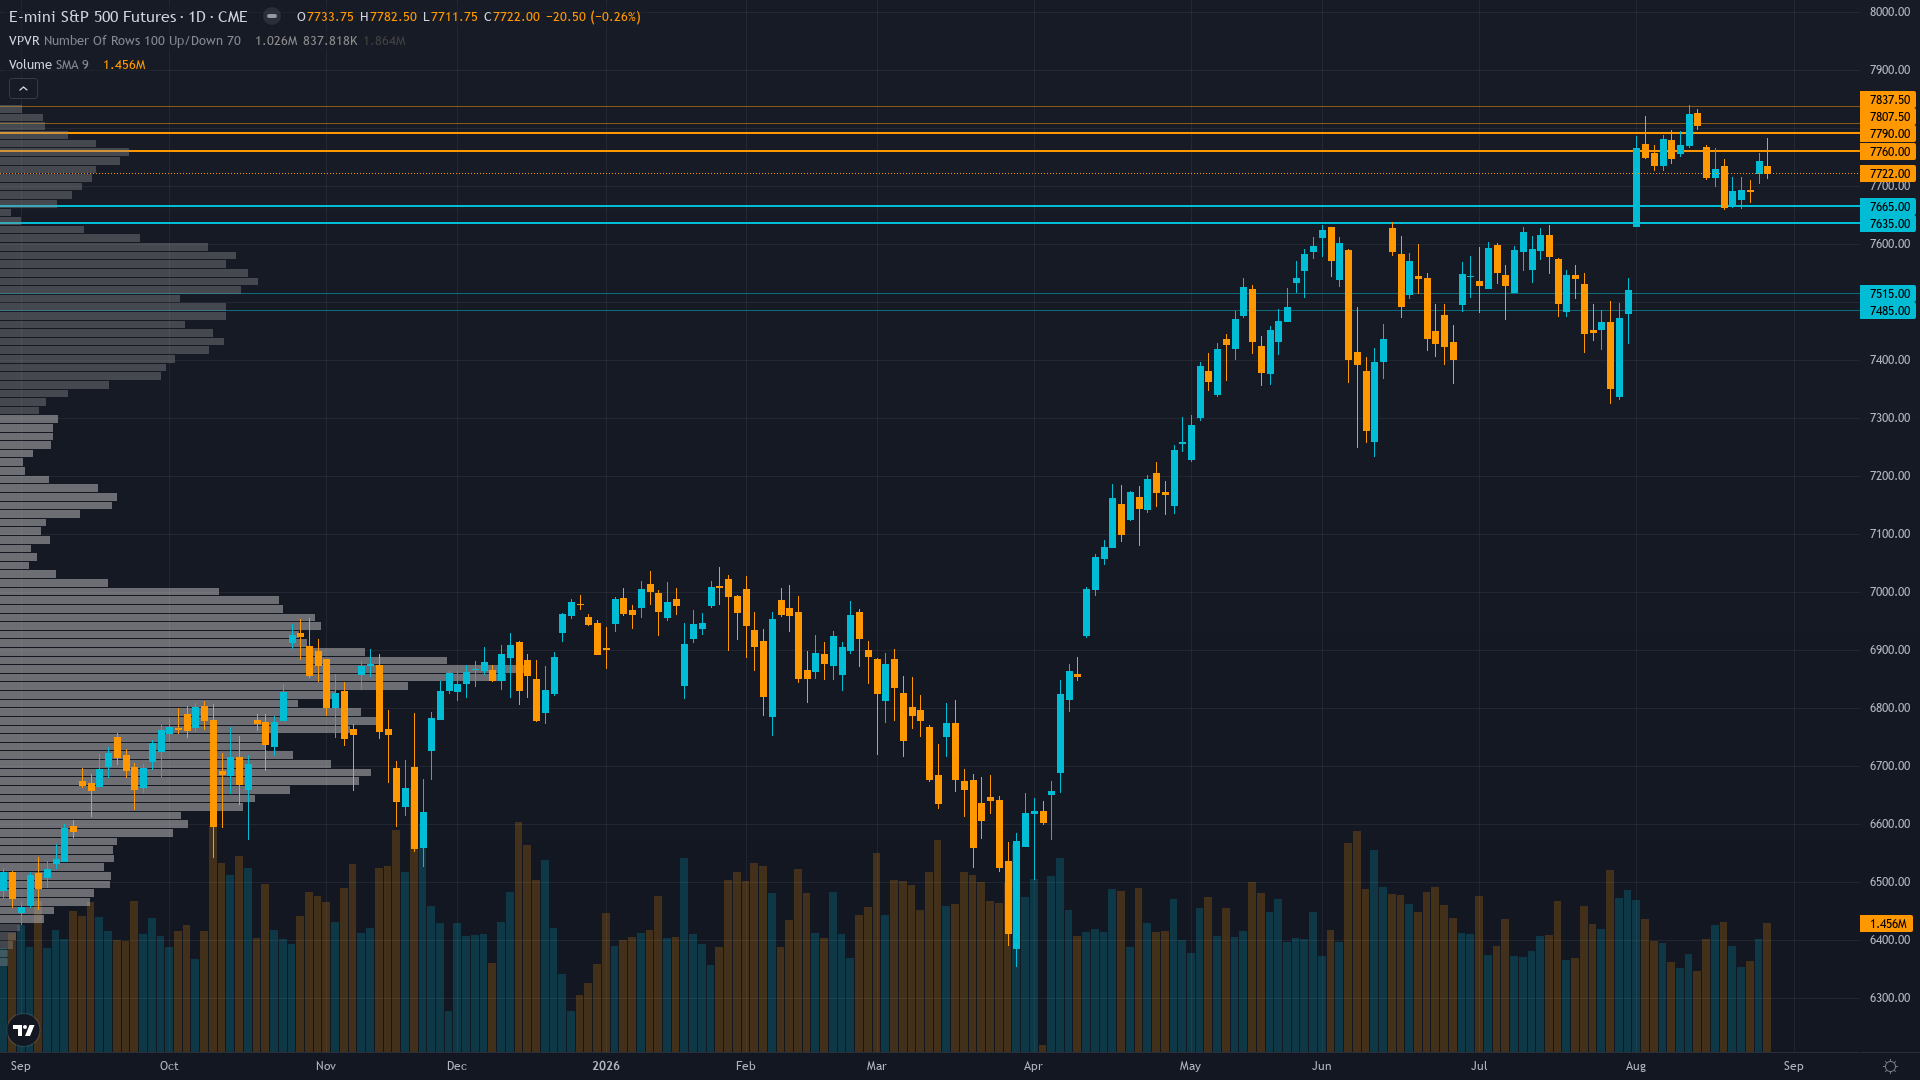
S&P 500 is trading at 7722, down 0.26% in a measured pullback. S&P 500 futures is consolidating, with price compressing into a narrower range as the market builds energy for its next move.
Cautiously positioned for continued consolidation near 7,700-7,800 ahead of the dense Sep 1-2 catalyst cluster, with expectations tilted modestly positive on ISM Manufacturing staying expansionary but increasingly aware of September seasonal headwinds after the failed breakout from 7,822.5 ATH
What's Driving Price
Primary driver: ES consolidates near 7,722 after +0.4% weekly gain that recovered from the prior week's -1.46% pullback from 7,822.5 ATH, with speculative net short positioning surging by -57,434 contracts in one week (CFTC Aug 25) to -67,994 creating powerful short-covering squeeze potential, but the market faces a dense catalyst cluster Sep 1-2 with ISM Manufacturing PMI (est 55.3 vs 55.6), JOLTs, ADP Employment, and Beige Book all arriving in the historically weakest seasonal month for equities
Secondary factor: CFTC COT data Aug 25, 2026 reveals non-commercial net position flipped from -10,560 net short two weeks ago to -67,994 net short now — a -57,434 contract single-week increase representing -9.2% of open interest — the largest one-week speculative short build since at least early 2026, creating extreme short-covering asymmetry that represents the most powerful institutional setup on the board
Additional influence: September seasonal headwinds begin Monday with S&P 500 historically averaging -0.7% in September (the only month with sub-50% positive close rate since 1950 per SimianX data), while markets price 85% probability of a 25bp cut at September FOMC — the tension between dovish Fed expectations and the worst seasonal month creates a conflicting backdrop that caps conviction on any directional call
Economic backdrop: Fed on hold at 3.63% with markets pricing 85% probability of 25bp cut at September FOMC, inflation stable at 2.31%, unemployment 4.1% — ISM Manufacturing PMI (Sep 1, est 55.3 vs prior 55.6) and ADP Employment (Sep 2, est 47K vs 44K) are the key near-catalysts testing whether expansionary conditions persist
Fundamental assessment: Forward P/E 19.5-20.1x slightly above historical averages but supported by strong 30% YoY earnings growth projections for 2026 — Q3 earnings season begins mid-September, creating a 2-week data vacuum until then
Chart Assessment
Daily uptrend intact with ES at 7,722 above all key MAs at 93% of 52-week range, but price consolidating below 7,775-7,822.5 resistance after failed breakout from ATH two weeks ago — 7,700-7,715 support zone is the critical floor that must hold to prevent test of 7,650 major support
With trend strength at 6/10, there's a clear directional tilt but room for the move to develop further.
Risk & Opportunity
Primary risk: Dense catalyst cluster Sep 1-2 delivers downside surprises — ISM Manufacturing below 54.0 or ADP Employment below 40K — challenging the expansionary narrative while speculative shorts are crowded and VIX is compressed at 2026 lows, triggering a vol expansion event that tests 7,650 major support and potentially 7,500 if breakdown accelerates (Probability: medium)
Primary opportunity: ISM Manufacturing PMI beats expectations or JOLTs data shows continued tight labor market, validating the soft-landing narrative and triggering violent short covering from the -67,994 contract speculative net short position (largest single-week build in 2026) that could propel ES above 7,775 resistance toward a retest of the 7,822.5 ATH in a compressed-vol squeeze (Timeframe: September 1-4 2026)
This week's edge: The market may be underweighting the speed and magnitude of the CFTC speculative short build — -57,434 contracts in a single week to -67,994 net short — creating the most powerful short-covering squeeze setup of 2026 that any positive ISM/ADP/JOLTs catalyst could ignite, while simultaneously overpricing the probability of a September selloff based purely on calendar effects rather than fundamental deterioration. However, signal below Min Signal threshold requires NO CALL — directional edge insufficient despite structural asymmetry.
Volatility Backdrop
ES futures sits in a low-volatility regime (28th percentile), where the calm surface often masks building pressure. Volatility contraction continues, building the stored energy that typically precedes the next significant directional move.
Low volatility regime suggests 0.6-1.0% daily ES moves (~45-75 point range) — current VIX 14.44 prices ~0.9% one-standard-deviation daily moves. The dense Sep 1-2 catalyst cluster creates potential for 1.5-2.5% directional expansion on data surprises either direction. Support 7,700 and resistance 7,775 define the consolidation zone.
The Week Ahead
ISM Manufacturing PMI (Aug) — estimate 55.3 vs previous 55.6 — key test of whether manufacturing expansion continues after July beat, with Polymarket pricing 32% probability of 55.0-55.9 range on Tuesday 1 September is a high-impact catalyst with the potential to redefine the near-term outlook entirely.
How S&P 500 navigates the confluence of consolidating conditions and incoming data will determine whether the current directional thesis holds or breaks.
This analysis covers one dimension. Our full weekly report combines six specialist agents into a single actionable briefing with directional bias, key levels, and risk-opportunity matrix.
Start Free — Get the Market of the WeekFree weekly report · No credit card · Upgrade anytime



